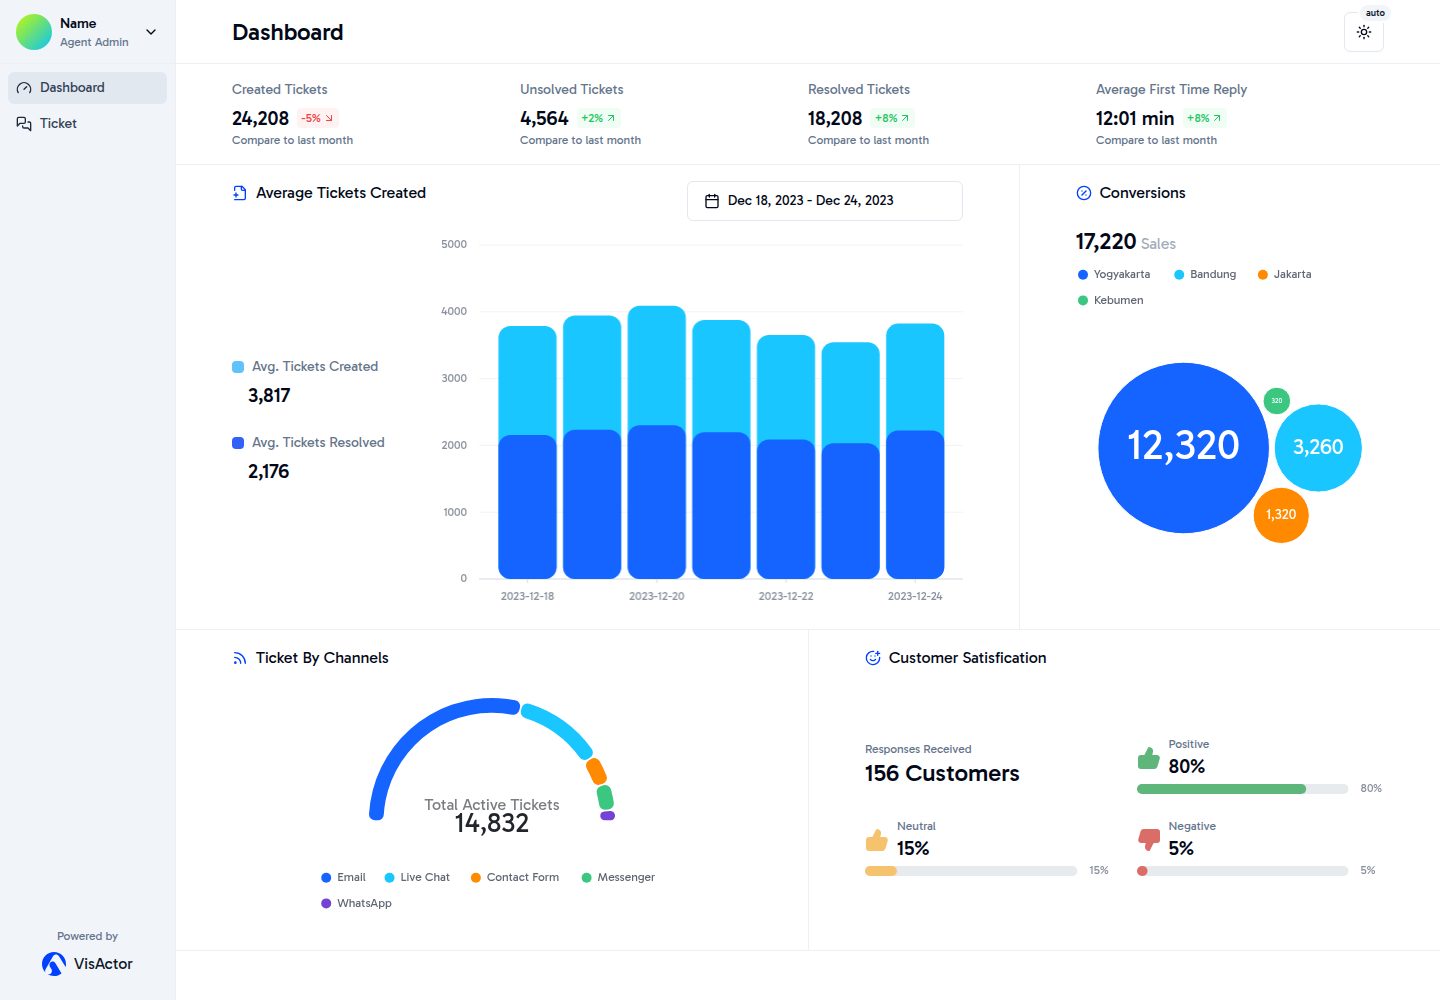
Includes multiple VisActor chart examples: bar chart, gauge chart, circular packing chart, linear progress, and more
Next.jsReactAdmin dashboard
visactor-next-template — Next.js Admin dashboard Template
By mengxi-ream
A data dashboard template built with Next.js and VisActor, including multiple chart components, dark mode, and responsive layout.
Explore the design
Compare the page layouts and mobile experience. Open any screenshot for a closer look.
Desktop homepage1 / 2
Desktop captureTop of page
Actual screenshot captured by the server browser.
All pages & views 2
Screenshots show visual appearance; interactive behavior may differ.
Recorded 2026-10-02View source
What stands out
A quick read of the recorded project description.
Supports dark/light mode switching and follows system preferences
Responsive layout with desktop and mobile views
Interface built with Tailwind CSS and Shadcn components
State management with Jotai, type constraints provided by TypeScript
Template Details
This is a template for admin data interfaces, using Next.js App Router to organize pages, with charts provided by VisActor, interface styling based on Tailwind CSS, UI components from Shadcn, state management with Jotai, and written entirely in TypeScript.
The template includes several example charts, such as Average Tickets Created (bar chart), Ticket by Channels (gauge chart), Conversions (circular packing chart), Customer Satisfaction (linear progress), and Metrics Overview, along with sample data for directly viewing chart rendering effects.
The interface supports dark/light mode switching and follows system preferences, with a responsive layout that displays on desktop and mobile. The repository is under the MIT license, allowing free use, modification, and distribution, but third-party assets such as demo images, fonts, and icons require separate license verification, and external services like domains and hosting may incur costs.
Next.jsAdmin dashboard
Is it right for your project?
Use Cases
- Building an admin data dashboard that needs to display multiple types of metric charts
- As a reference for interface and chart structure in a Next.js App Router project
- Interface prototype for displaying data visualization content in dark mode
Suitable For
- Data visualization admin projects that need a quick start
- Developers using the Next.js and VisActor tech stack
- Frontend projects looking for a reference interface combining Tailwind CSS and Shadcn
Getting started & customization
Use these recorded setup notes alongside the repository instructions for your chosen version.
- 1
After cloning the repository, install dependencies with pnpm install
- 2
Start the development server with pnpm dev, accessible by default at http://localhost:3000
- 3
You can also deploy directly by clicking the Vercel button in the README
- 4
Chart data comes from sample data under src/data and needs to be replaced with actual data sources
- 5
Third-party assets such as demo images, fonts, and icons must be checked against their respective licenses
License & source material
Usage conditions & limitations
Free to use · keep license noticeThis entry covers the free version under the MIT license in a public repository; the free scope is the code of this version and does not imply that external services or third-party assets are free.
Must comply with when using
- Free use, modification, commercial use, and distribution of this version's code are permitted.
- When distributing copies or substantial portions of the code, retain the original author's copyright notice and the full MIT license notice.
- The code is provided as-is; warranties and limitations of liability are governed by the original license and applicable law.
Additional costs & items to verify
- Demo images, fonts, icons, and other third-party assets must be checked against their respective licenses and cannot be judged solely by the code's MIT license.
- External services such as domains, hosting, databases, payments, or AI may incur additional charges.
View Original Text Basis
https://github.com/mengxi-ream/visactor-next-template/blob/main/LICENSEhttps://github.com/mengxi-ream/visactor-next-template/blob/main/README.mdPermission is hereby granted, free of charge
Original License Text
Compiled by DeepSeek based on repository license and README ·2026-10-02. Results only cover the materials read; dependencies, images, fonts, and subsequent term changes are subject to their respective original texts.
Project checks & description sources
Template Information
- Source platforms
- GitHub
- Documentation and maintenance reference score
- More documented · 91 / 100
- Technologies
- Next.js · React
- Website type
- Admin dashboard
How this score is calculated
Our heuristic uses license records (up to 30), a demo link (12), a preview (10), stars (15), recorded maintenance (15), description completeness (8), feature records (5) and classification data (5). It is not a code, security or performance test, or a Google score. A link does not establish tested functionality.
What to verify for this project
- Repository update recorded
- 2025-12-11
- Screenshot last checked
- 2026-10-02
A demo link is listed. Check it with your own content and viewport sizes; its presence does not confirm that forms, authentication or payments work.
The catalog identifies Next.js as the primary stack. Check the actual dependency manifest and lockfile for versions and hosting requirements. These notes use recorded metadata, not a code audit or a deployment test.
Use a selection guide →How this description was prepared
AI-assisted description based on catalog records and repository material. Repository authors are not automatically the reviewers of this description.
Automatically checked against source and license rules; no manual editorial review.
Inspect the recorded source material
SHA-256: 2045a2c12c4ecfa401502da795660b0a0fd0403f5593658dbe684543904da047
2026-10-02T19:39:21.072Z
Source file / repository# VisActor Next.js Dashboard Template A modern dashboard template built with [VisActor](https://visactor.io/) and Next.js, featuring a beautiful UI and rich data visualization components. [Live Demo](https://visactor-next-template.vercel.app/) [](https://vercel.com/new/clone?demo-description=A%20modern%20dashboard%20with%20VisActor%20charts%2C%20dark%20mode%2C%20and%20data%20visualization%20for%20seamless%20analytics.&demo-image=%2F%2Fimages.ctfassets.net%2Fe5382hct74si%2F646TLqKGSTOnp1CD1IUqoM%2Fa119adac1f5a844f9d42f807ddc075f5%2Fthumbnail.png&demo-title=VisActor%20Next.js%20Template&demo-url=https%3A%2F%2Fvisactor-next-template.vercel.app%2F&from=templates&project-name=VisActor%20Next.js%20Template&repository-name=visactor-nextjs-template&repository-url=https%3A%2F%2Fgithub.com%2Fmengxi-ream%2Fvisactor-next-template&skippable-integrations=1) ## Features - 📊 **Rich Visualizations** - Powered by VisActor, including bar charts, gauge charts, circle packing charts, and more - 🌗 **Dark Mode** - Seamless dark/light mode switching with system preference support - 📱 **Responsive Design** - Fully responsive layout that works on all devices - 🎨 **Beautiful UI** - Modern and clean interface built with Tailwind CSS - ⚡️ **Next.js 15** - Built on the latest Next.js features and best practices - 🔄 **State Management** - Efficient state management with Jotai - 📦 **Component Library** - Includes Shadcn components styled with Tailwind ## Tech Stack - [Next.js](https://nextjs.org/) - React framework - [VisActor](https://visactor.io/) - Visualization library - [Tailwind CSS](https://tailwindcss.com/) - CSS framework - [Shadcn](https://ui.shadcn.com/) - UI components - [Jotai](https://jotai.org/) - State management - [TypeScript](https://www.typescriptlang.org/) - Type safety ## Quick Start You can deploy this template to Vercel by clicking the button above, or clone this repository and run it locally. [Github Repo](https://github.com/mengxi-ream/visactor-next-template) 1. Clone this repository ```bash git clone https://github.com/mengxi-ream/visactor-next-template ``` 2. Install dependencies ```bash pnpm install ``` 3. Run the development server ```bash pnpm dev ``` 4. Open [http://localhost:3000](http://localhost:3000) with your browser to see the result. ## Project Structure ```bash src/ ├── app/ # App router pages ├── components/ # React components │ ├── chart-blocks/ # Chart components │ ├── nav/ # Navigation components │ └── ui/ # UI components ├── config/ # Configuration files ├── data/ # Sample data ├── hooks/ # Custom hooks ├── lib/ # Utility functions ├── style/ # Global style └── types/ # TypeScript types ``` ## Charts This template includes several chart examples: - Average Tickets Created (Bar Chart) - Ticket by Channels (Gauge Chart) - Conversions (Circle Packing Chart) - Customer Satisfaction (Linear Progress) - Metrics Overview ## Contributing Contributions are welcome! Please feel free to submit a Pull Request. ## License This project is licensed under the MIT License - see the [LICENSE](LICENSE) file for details. ## Acknowledgements - [VisActor](https://visactor.io/) - For the amazing visualization library - [Vercel](https://vercel.com) - For the incredible deployment platform - [Next.js](https://nextjs.org/) - For the awesome React framework
Explore similar templates
Compare previews and descriptions within the same stack and category.
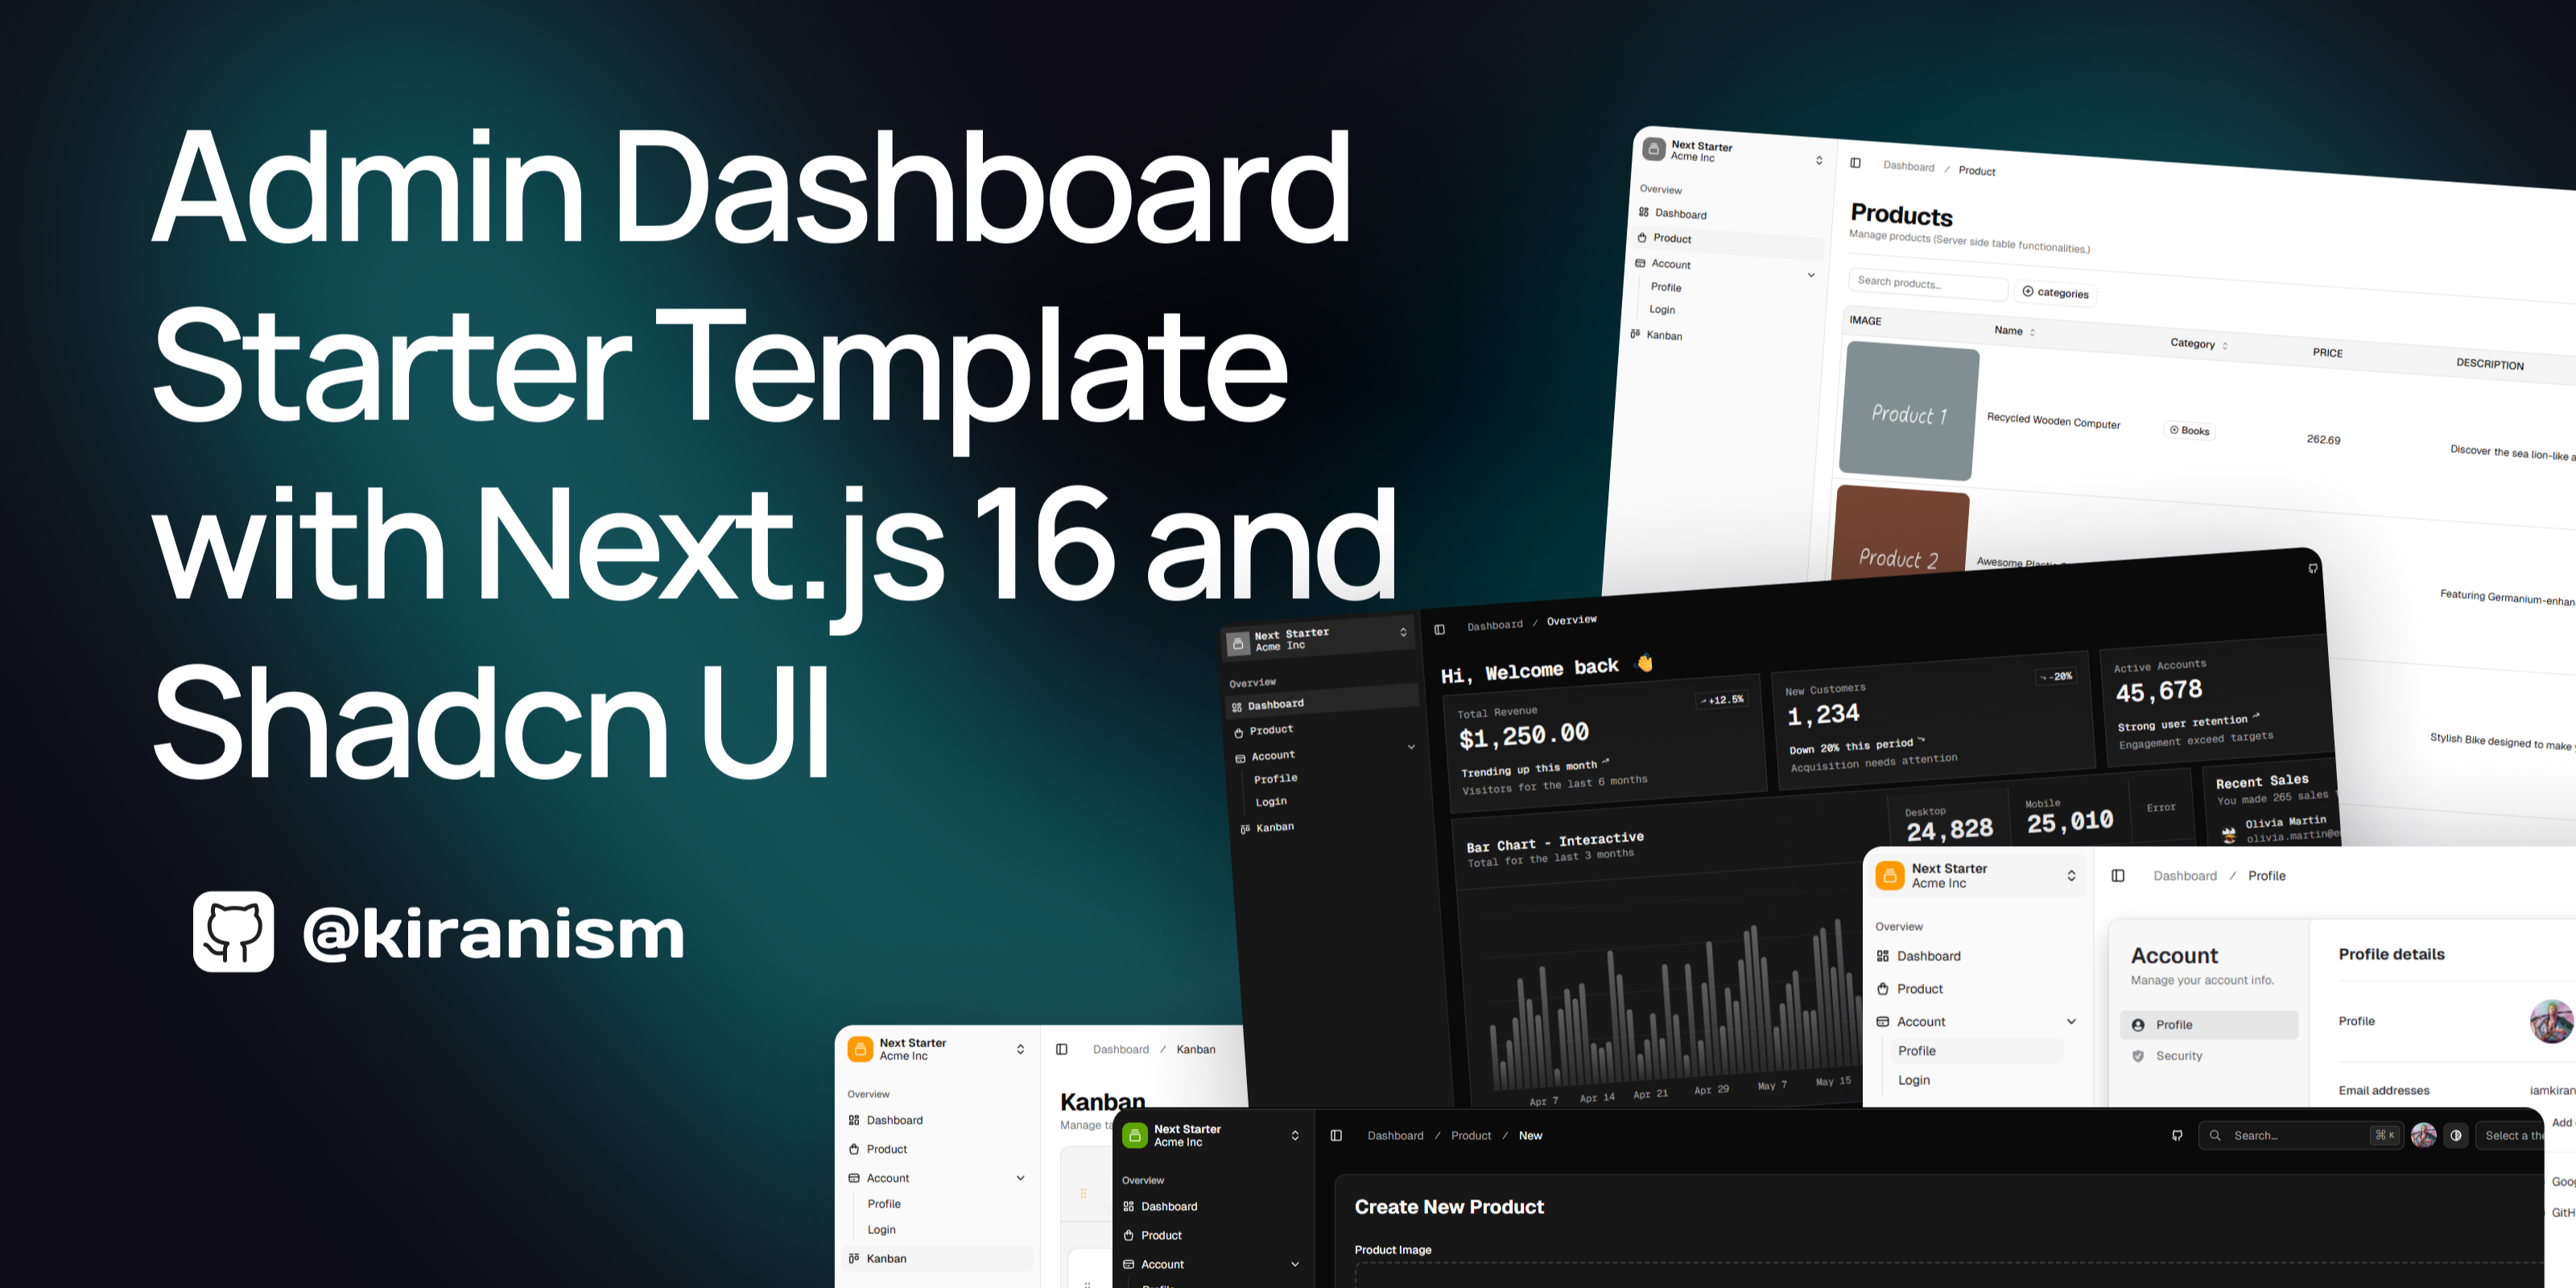
next-shadcn-dashboard-starter
An MIT-licensed admin dashboard starter built with Next.js 16, shadcn/ui, Tailwind CSS v4, and TypeScript.
Next.js · Admin dashboard
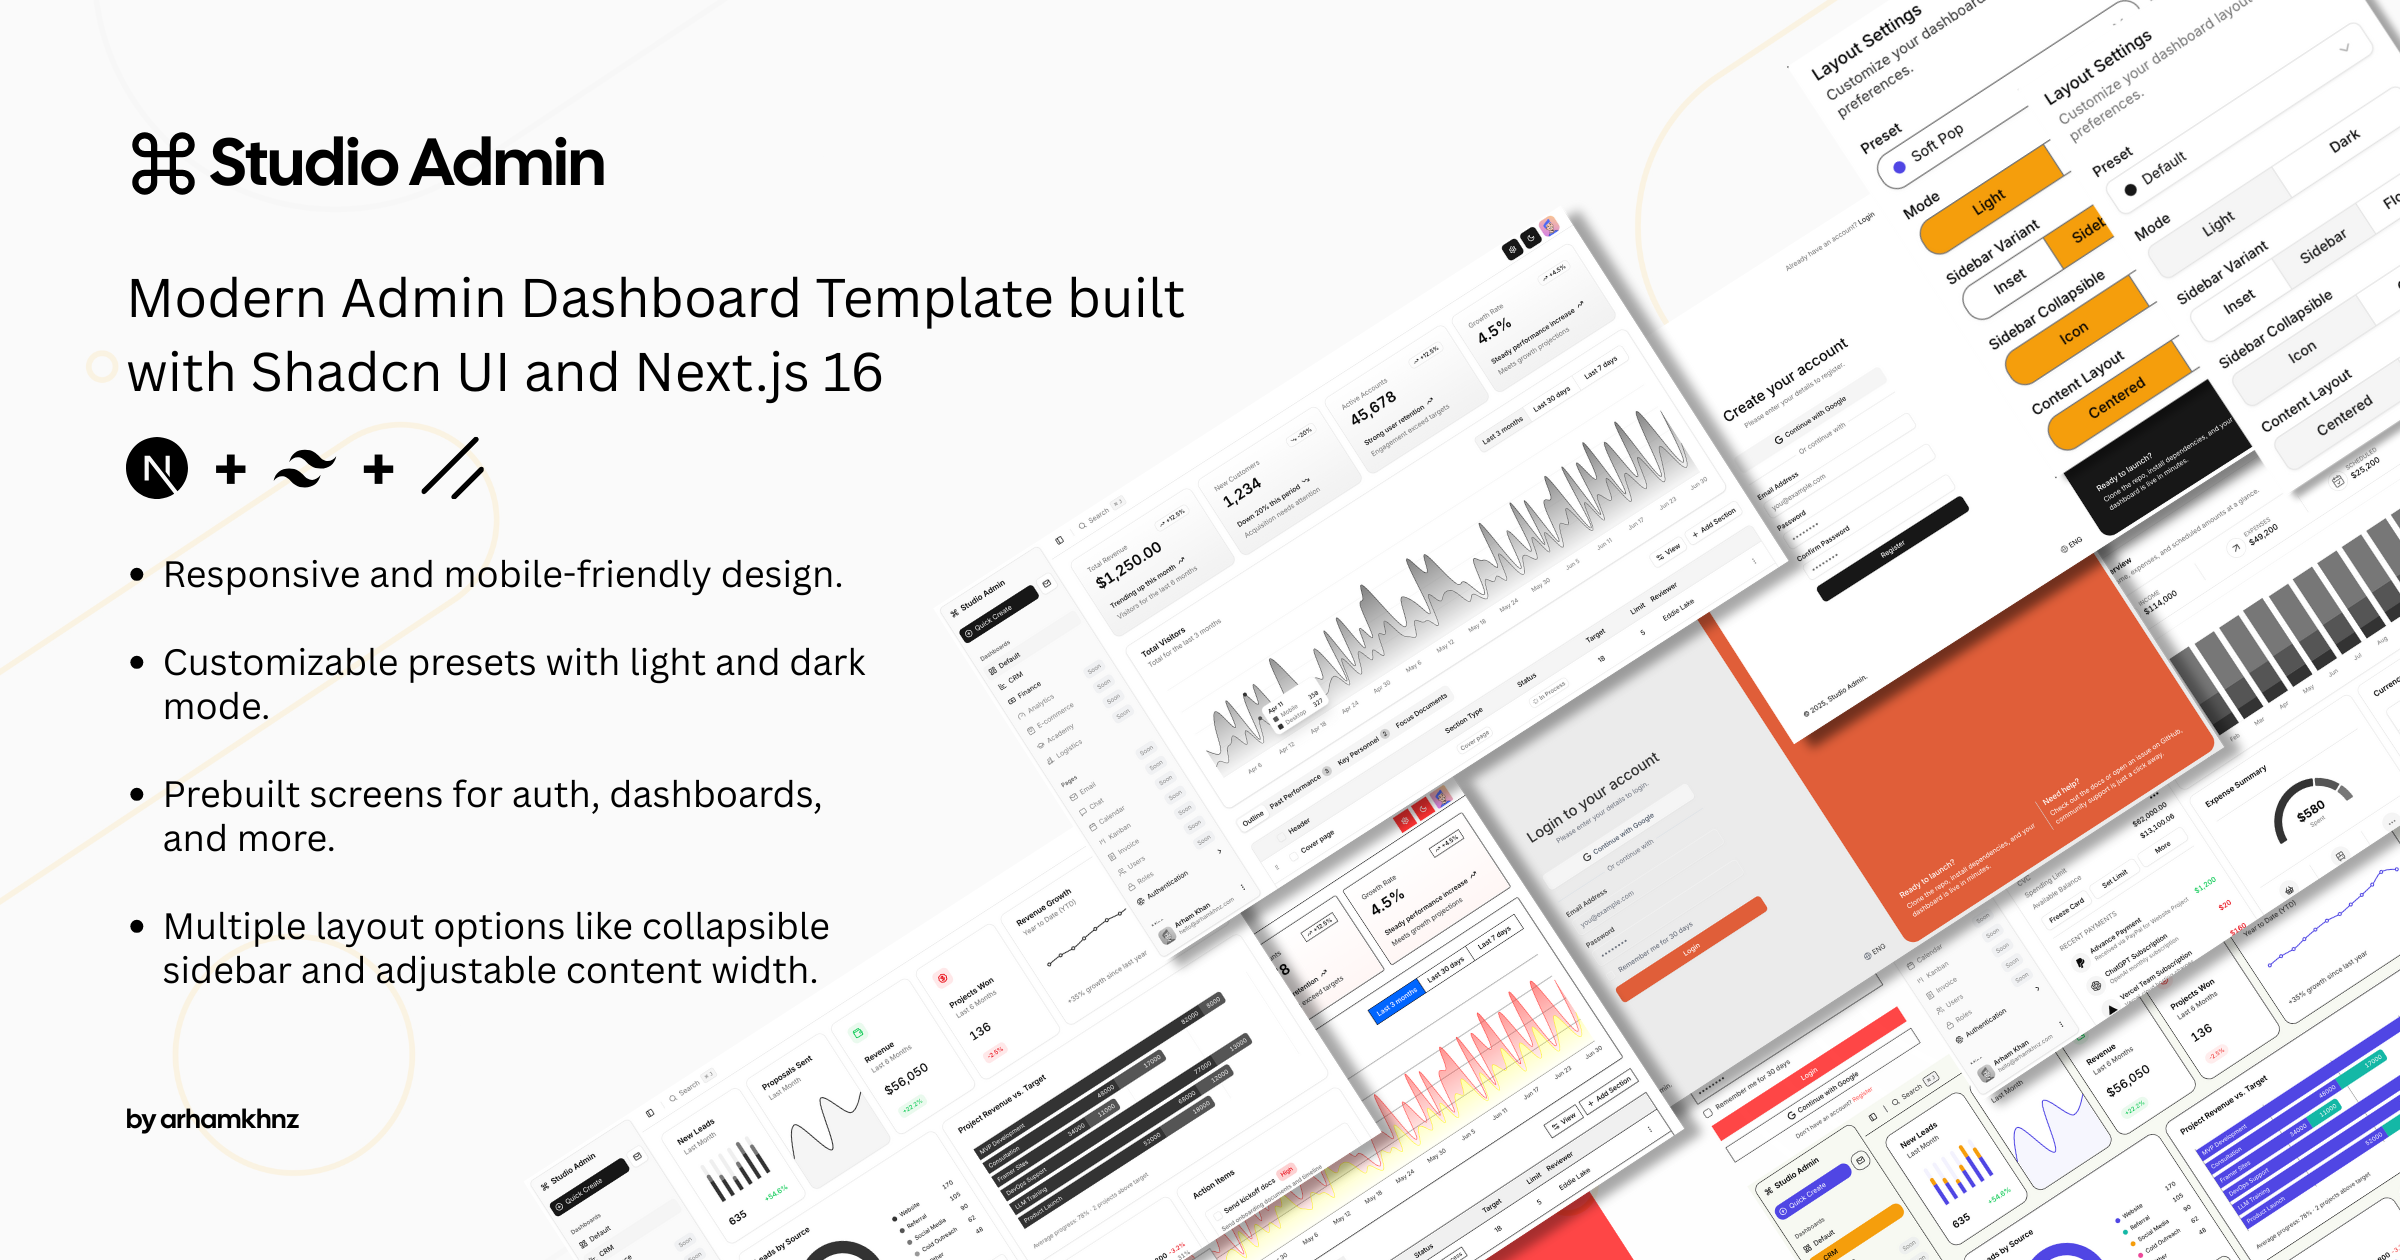
Studio Admin · Radix UI
Studio Admin is an admin dashboard template built with Next.js 16, TypeScript, Tailwind CSS v4, and Shadcn UI.
Next.js · Admin dashboard
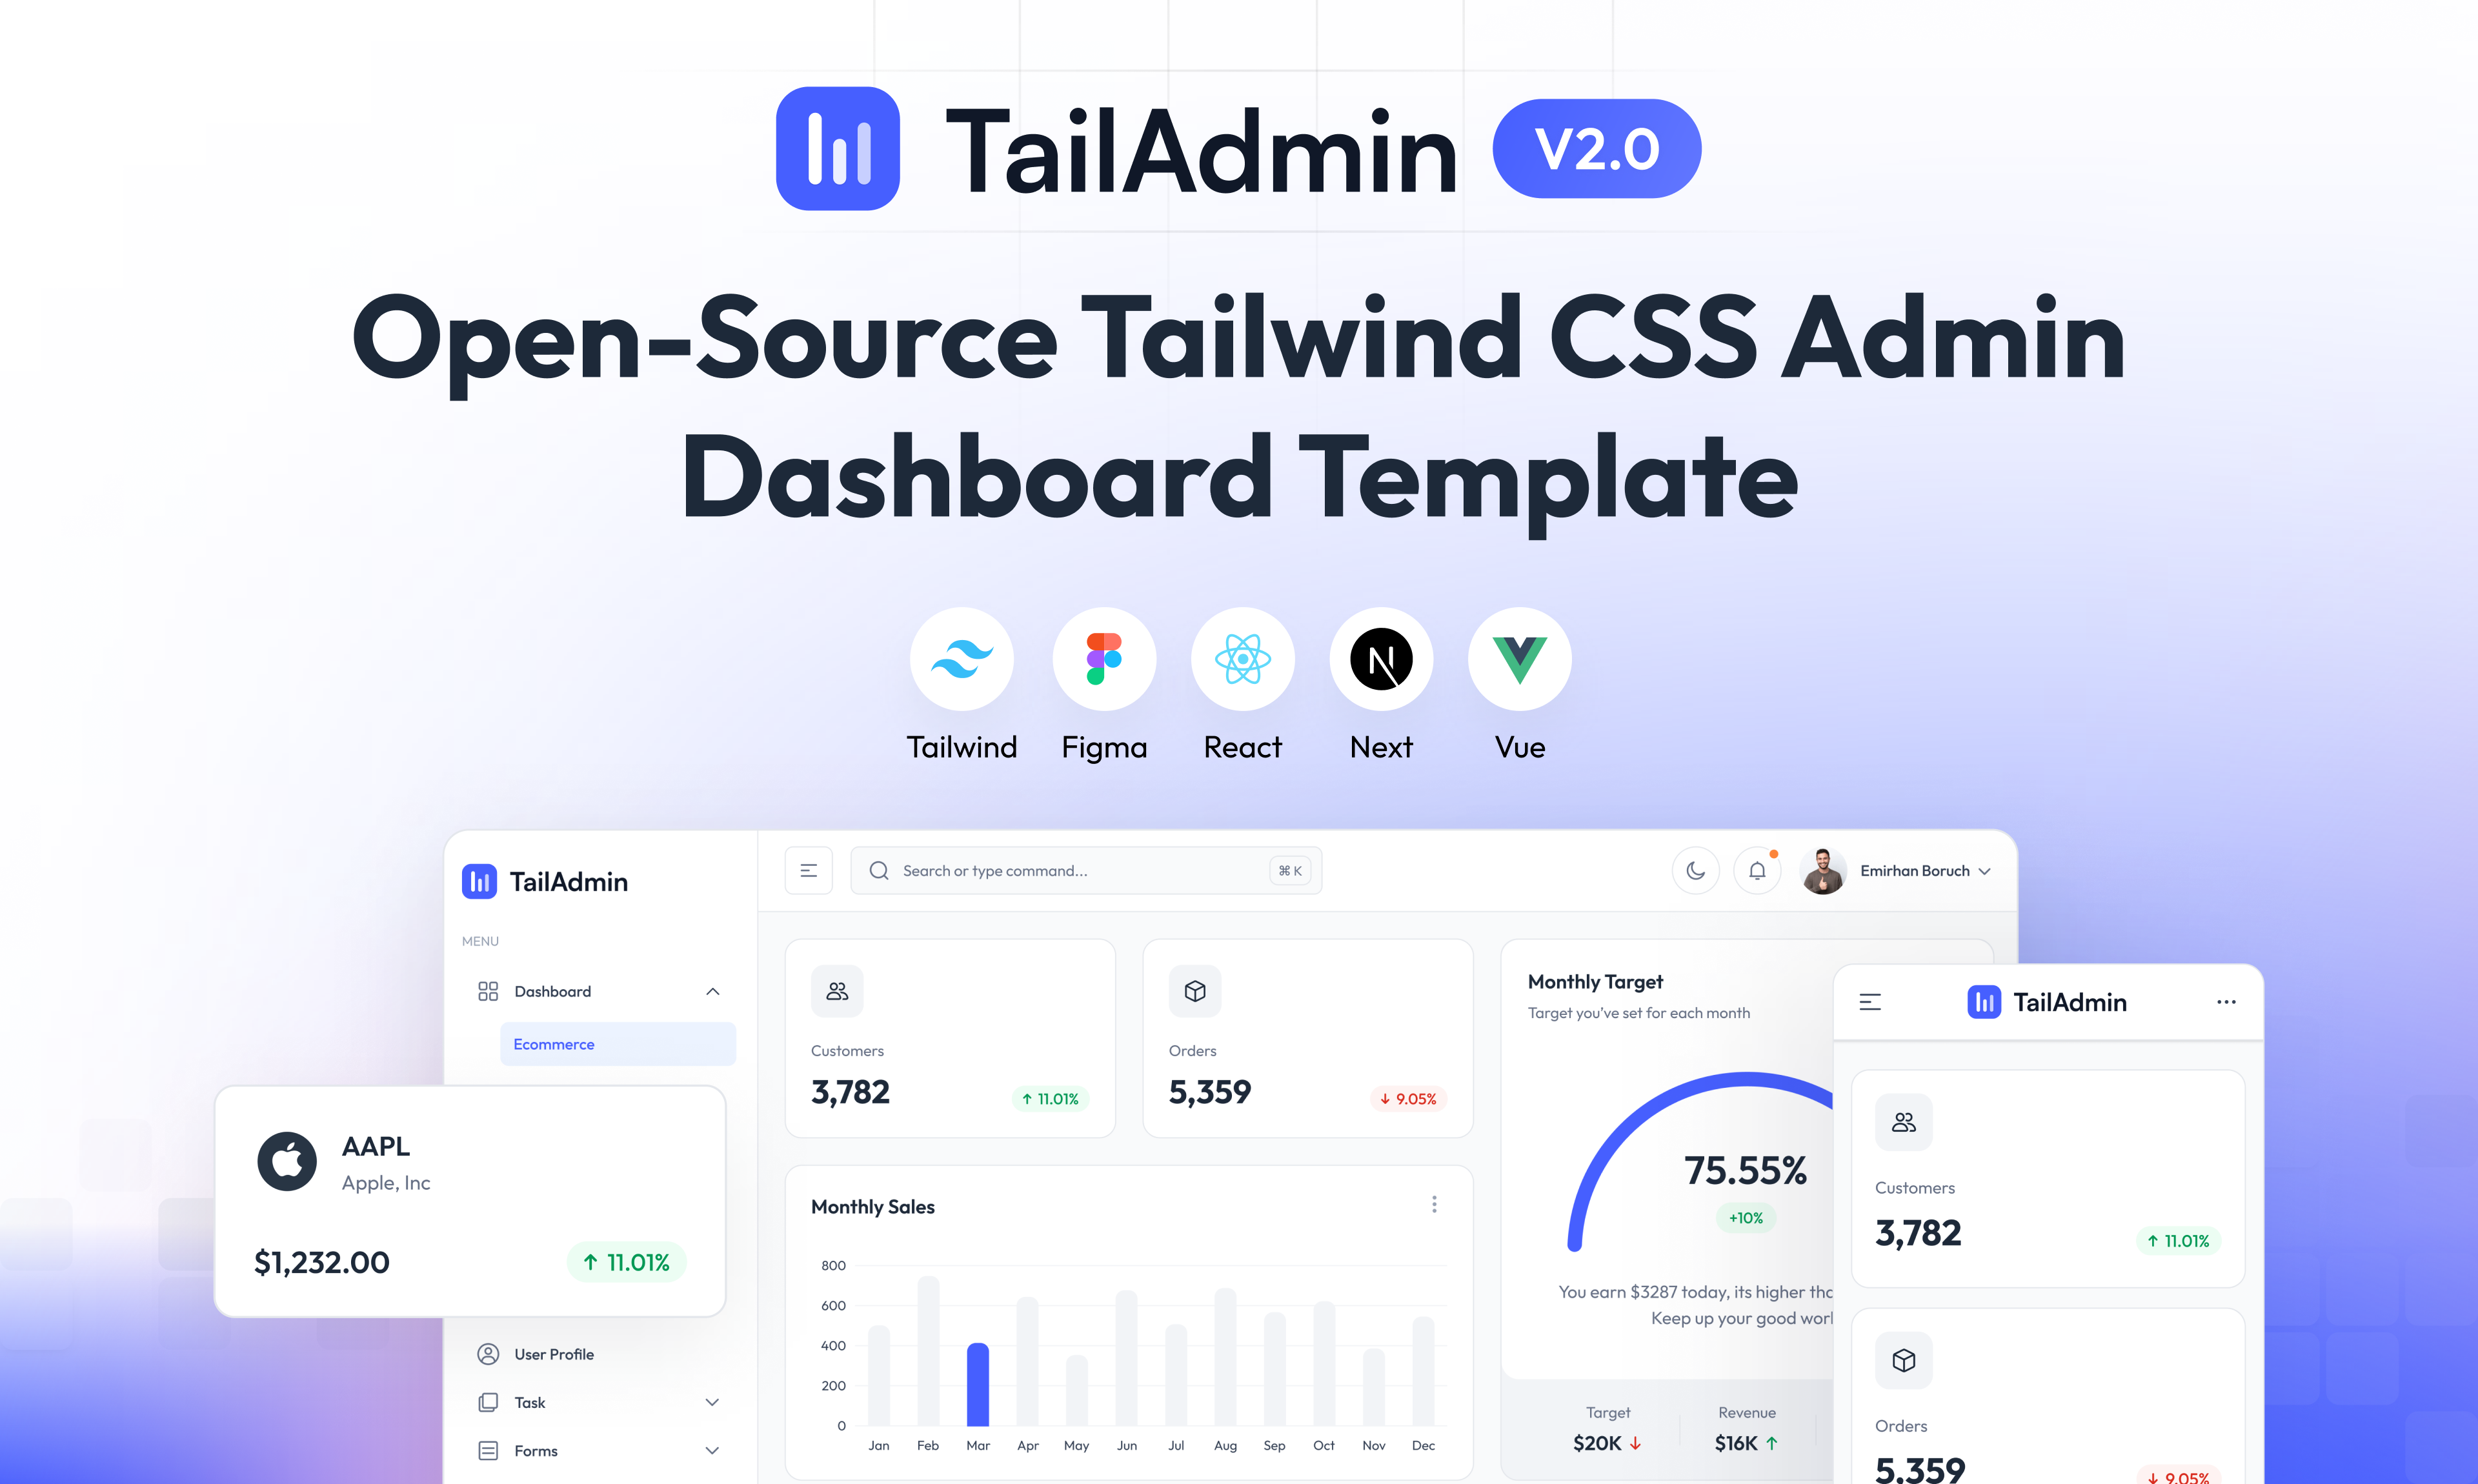
free-nextjs-admin-dashboard
A free, open-source admin dashboard template built on Next.js 16, React 19, TypeScript, and Tailwind CSS v4. It provides a collapsible sidebar, charts, tables, authentication forms, modals, dropdowns, and dark mode, with internationalization and RTL support since version 2.4.0.
Next.js · Admin dashboard
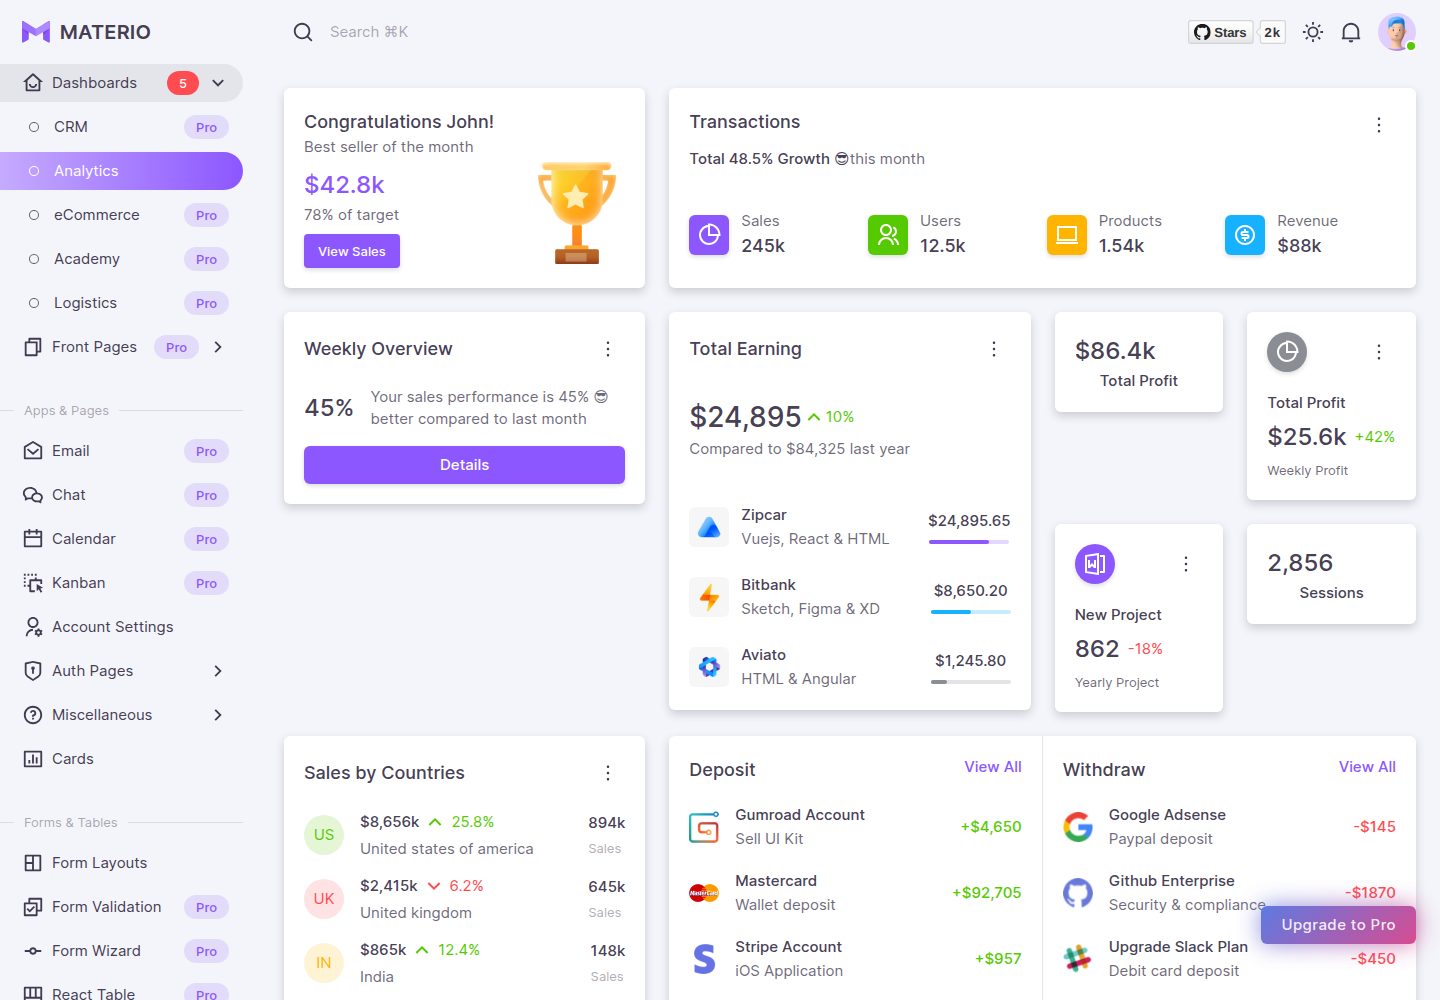
materio-mui-nextjs-admin-template-free
Materio Free is a Next.js admin dashboard template based on App Router and MUI, integrating Tailwind CSS and available in TypeScript and JavaScript versions.
Next.js · Admin dashboard
nextjs-postgres-nextauth-tailwindcss-template
A Vercel-maintained Next.js App Router admin dashboard starter with Auth.js GitHub OAuth, Postgres, Tailwind CSS, and Shadcn UI, plus a sample products table, seed endpoint, and CRUD interface.
Next.js · Admin dashboard
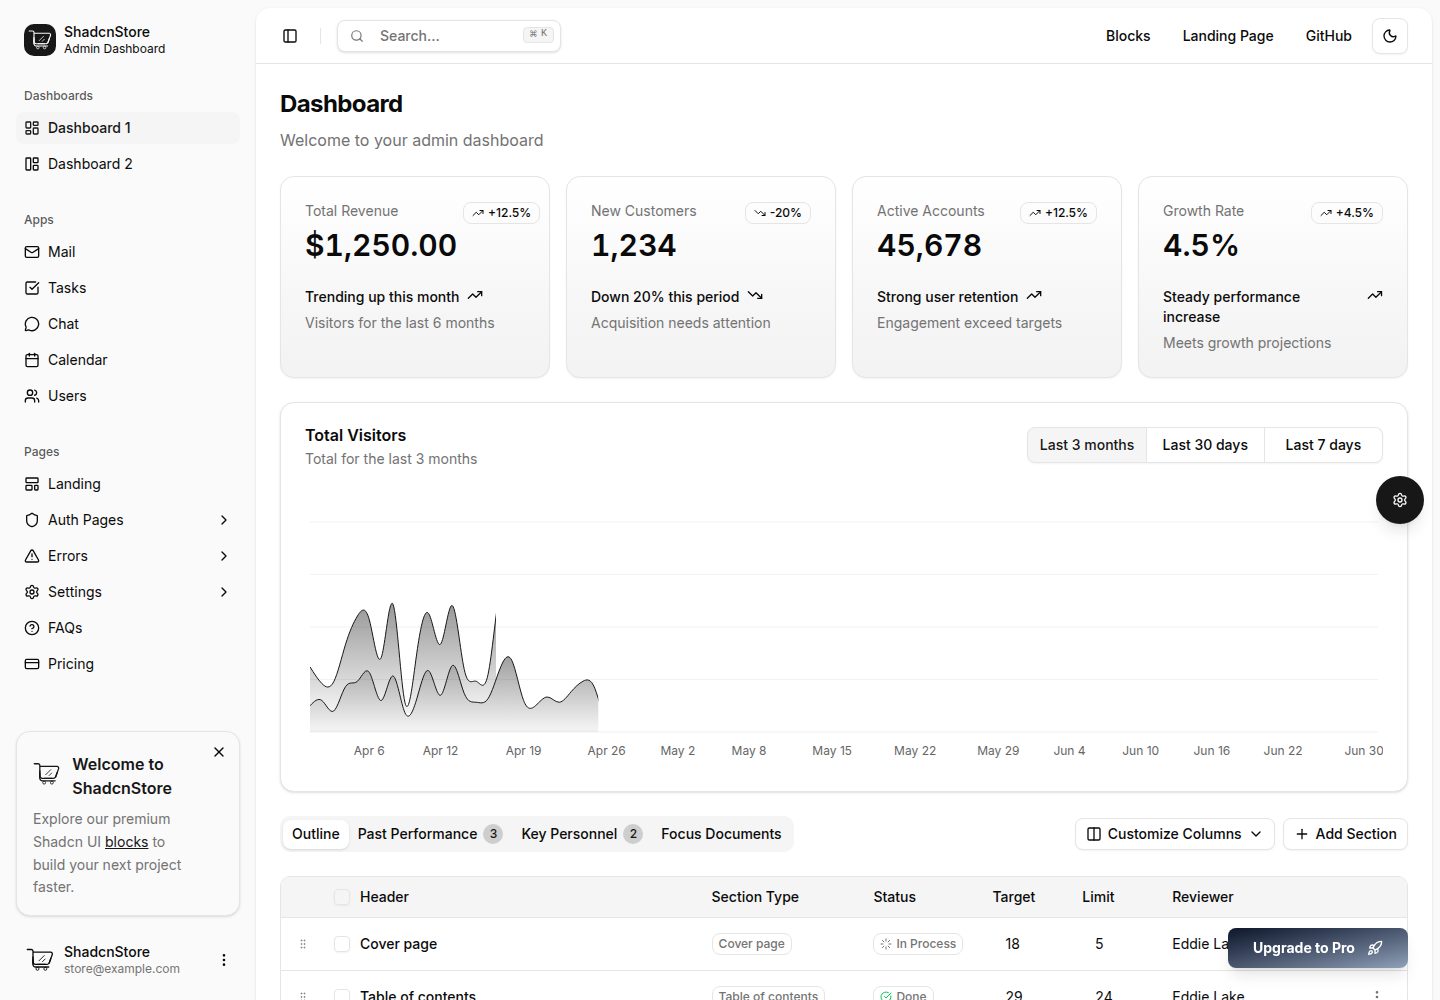
shadcn-dashboard-landing-template
An open-source admin dashboard and marketing landing page template built on shadcn/ui and Tailwind CSS, with both Vite + React and Next.js versions in one repository.
Next.js · Admin dashboard