Single-page static dashboard with no build step, backend or installation; open index.html to run
HTMLAdmin dashboard
pm-dashboard-public — HTML Admin dashboard Template
By lenumiranda
A single-page static dashboard template for automation project management, using fictional data to display project portfolio, roadmap, hours burn, RAID log and schedule variance.
Explore the design
Compare the page layouts and mobile experience. Open any screenshot for a closer look.
Desktop homepage1 / 2
Desktop captureTop of page
Actual screenshot captured by the server browser.
All pages & views 2
Screenshots show visual appearance; interactive behavior may differ.
Recorded 2026-10-02View source
What stands out
A quick read of the recorded project description.
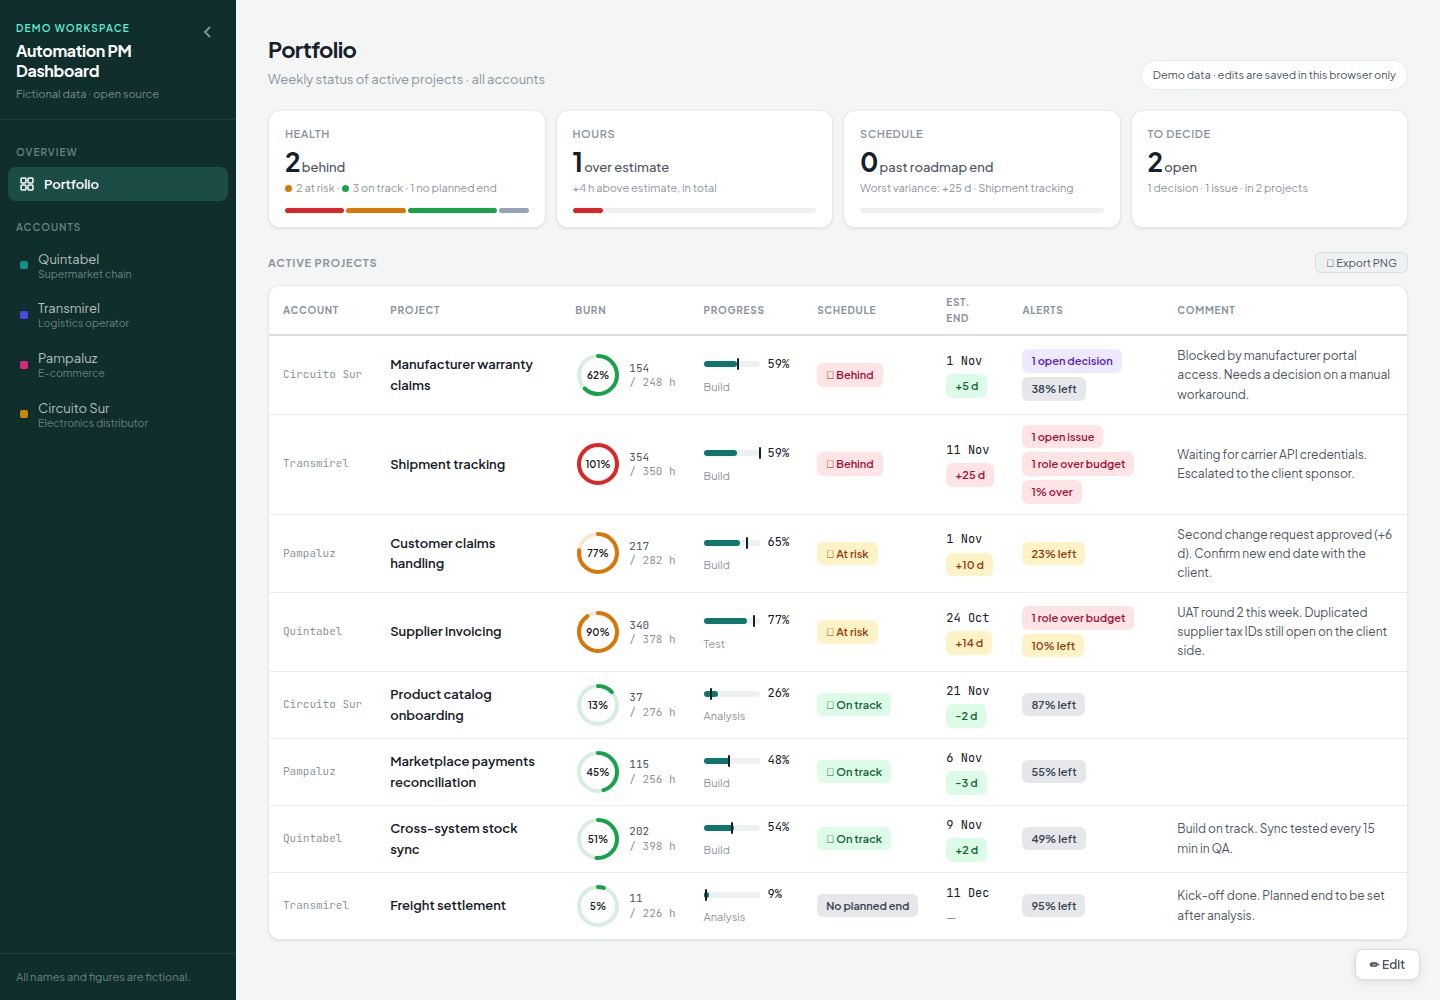
Portfolio view includes four PMO cards for health, hours, schedule and decisions pending, plus a table of active projects sorted by red/yellow/green
Account dashboard provides a Gantt roadmap (day/week views, milestones, blockers, PNG export), schedule table, schedule metrics and RAID log
Hours tab shows total burn, phase pills, role cards and a role×phase matrix
Edit mode supports modifying roadmap, schedule, commentary, docs checklist and links, with changes saved immediately in the browser
Light and dark themes follow system settings; thresholds, phases, holidays and role order can be configured in config.js
Template Details
This is a single-page dashboard template for automation projects (RPA, workflow and integration projects), running as a static site with no build step, backend or installation. The demo data is fictional and includes four retail and logistics clients and nine projects.
The page is divided into a portfolio view and an account dashboard. The portfolio view provides four PMO cards (health, hours, schedule, decisions pending) and a table of active projects sorted by red/yellow/green, with each row showing a burn ring, roadmap progress, schedule badge, forecast end date and variance, alerts from the RAID log and hours, and weekly commentary. Clicking a row opens the project detail. The account dashboard is organized by account and includes a roadmap (Gantt chart with day/week views, today line, milestones, blockers, project closure markers and PNG export), schedule table, schedule metrics, schedule badges, RAID log, hours tab (total burn, phase pills, role cards and role×phase matrix), run/docs/links tabs, and a dated commentary log.
Editing is accessed via the edit button in the bottom right, allowing edits to the roadmap (add/remove/reorder phases, set dates, colors and markers, add blockers, milestones and closure dates), schedule percentages, commentary, docs checklist and links, and RAID entries. All changes save immediately, but only UI-editable fields are saved; hours, roles and status always come from the data files.
The template offers light and dark themes that follow system settings; thresholds, phases, holidays, role order and checklists can be configured in config.js, and version history of saved edits can be restored from the browser console.
Usage limitations are explicit: no login or permissions, so anyone who can open the page can use edit mode; no database, so edits are stored only in the visitor's browser and are not shared, and clearing browser data deletes them; hours cannot be edited from the UI and must be changed in data/projects.js, with no import from timesheet tools; project status must be entered manually in the data files; once a roadmap has been edited from the UI, subsequent roadmap changes for that project in the data files are ignored until saved data is cleared; the project is a single file with no tests, designed to be read and modified directly rather than used as a library; phase, month and date names are in English with no translation layer.
HTMLBackend
Is it right for your project?
Use Cases
- PMs and delivery leads managing automation projects across multiple clients or business units who need a centralized view of project status
- Teams that want to host a lightweight status page for free and adapt it by editing plain JavaScript
- Situations requiring roadmap, hours burn, RAID log and schedule variance side by side to quickly answer whether projects are on track, how many hours have been used, and what is blocking
- Cases needing to export a table PNG for status reports or a roadmap PNG for communication
Suitable For
- Project managers managing RPA, workflow and integration automation projects
- Delivery leads who need to view portfolio status across multiple clients or business units
- Teams that accept the limitations of no login, no database, and edits saved only in the local browser
- Developers or technical PMs willing to edit data/projects.js and config.js to adapt their own data
Getting started & customization
Use these recorded setup notes alongside the repository instructions for your chosen version.
- 1
Download or clone the repository and open index.html directly in a browser to run
- 2
To use your own data, edit data/projects.js; field descriptions are in docs/data-schema.md
- 3
To adjust thresholds or phases, edit config.js; metric descriptions are in docs/metrics.md
- 4
To publish, enable GitHub Pages in repository settings and deploy from the root of the main branch
- 5
Edits are saved only in the visitor's browser and are deleted when browser data is cleared; to share edits, connect your own authenticated database
License & source material
Usage conditions & limitations
Free to use · keep license noticeThis listing covers the free version in the public repository under the MIT license; the free scope is the code of this version and does not imply that external services or third-party assets are free.
Must comply with when using
- You may use, modify, commercially use and distribute the code of this version for free.
- When distributing copies or substantial portions of the code, retain the original author's copyright notice and the full MIT license notice.
- The code is provided as is; warranties and limitations of liability are governed by the original license and applicable law.
Additional costs & items to verify
- No login or permission control: anyone who can open the page can enter edit mode and modify content, so it is not suitable for scenarios requiring access control or multi-user permission management.
- No database; edits are saved only in the visitor's local browser and are not shared; clearing browser data will lose edits. To share edits, connect your own authenticated database.
- Hours cannot be edited from the interface; estimates, hours used and roles must be changed in data/projects.js, and there is no import from timesheet tools.
- Project status must be entered manually in the data files; status filtering depends on that field; schedule levels and alerts are calculated automatically.
- Saved roadmap takes precedence: once a project's roadmap has been edited from the interface, subsequent roadmap changes for that project in the data files are ignored until saved data is cleared.
- Single file with no tests, designed to be read and modified directly, not suitable for use as a library.
- Phase, month and date names are in English with no translation layer; non-English users must modify them themselves.
- Depends on external resources: Google Fonts and html2canvas (for PNG export), requiring an internet connection; offline environments may affect fonts and export functionality.
- Demo images, fonts, icons and other third-party assets must be checked under their respective licenses and cannot be judged solely by the code's MIT license.
- External services such as domains, hosting, databases, payments or AI may incur additional charges.
View Original Text Basis
Permission is hereby granted, free of charge
Original License Text
**No login and no permissions.** Anyone who can open the page can use Edit mode.
Original README
**No database: browser storage only.** Edits are saved in the visitor's browser (mock backend) and are not shared.
Original README
**Hours are not editable from the UI.** Estimates, spent hours and roles are edited in `data/projects.js`. There is no import from timesheet tools.
Original README
**Project statuses are written by hand** in the data file (they drive the status filter); schedule levels and alerts are calculated.
Original README
**Saved roadmaps take priority.** Once a roadmap is edited from the UI, later changes to that project's roadmap in the data file are ignored until the saved data is cleared.
Original README
**Single file, no tests.** It is designed to be read and modified directly, not as a library.
Original README
Stage, month and day names are in English; there is no translation layer.
Original README
https://github.com/lenumiranda/pm-dashboard-public/blob/main/LICENSEhttps://github.com/lenumiranda/pm-dashboard-public/blob/main/README.mdExternal resources: Google Fonts and [html2canvas](https://html2canvas.hertzen.com/) for PNG export, pinned with an integrity hash.
Original README
Compiled by DeepSeek based on repository license and README ·2026-10-03. Results only cover the materials read; dependencies, images, fonts, and subsequent term changes are subject to their respective original texts.
Project checks & description sources
Template Information
- Source platforms
- GitHub
- Documentation and maintenance reference score
- More documented · 80 / 100
- Technologies
- HTML
- Website type
- Admin dashboard
How this score is calculated
Our heuristic uses license records (up to 30), a demo link (12), a preview (10), stars (15), recorded maintenance (15), description completeness (8), feature records (5) and classification data (5). It is not a code, security or performance test, or a Google score. A link does not establish tested functionality.
What to verify for this project
- Repository update recorded
- 2026-10-02
- Screenshot last checked
- 2026-10-03
A demo link is listed. Check it with your own content and viewport sizes; its presence does not confirm that forms, authentication or payments work.
The catalog identifies HTML as the primary stack. Check the actual dependency manifest and lockfile for versions and hosting requirements. These notes use recorded metadata, not a code audit or a deployment test.
Use a selection guide →How this description was prepared
AI-assisted description based on catalog records and repository material. Repository authors are not automatically the reviewers of this description.
Review declaration: [email protected] · 2026-10-04
Inspect the recorded source material
SHA-256: 9f966479fcdc9ff8077c7c0b9772ee84dc7a7fc404bdae8a3bd38ac9c0a20c18
2026-10-03T20:26:38.666Z
Source file / repository# Automation PM Dashboard **English** · [Español](README.es.md) A single-page dashboard template for project managers who run automation projects (RPA, workflow and integration projects). In one place it shows each project's roadmap, hours burn, RAID log and schedule variance against the planned end. It runs as a static site: no build step, no backend and no install. The demo ships with **fictional data** (four made-up retail and logistics accounts, nine projects). **Live demo:** https://lenumiranda.github.io/pm-dashboard-public/   ## The problem it solves In automation projects the status usually lives in several places: the roadmap in a slide, hours in a timesheet export, risks in a spreadsheet, and the planned date in someone's head. This template puts them side by side for every project, so you can answer three questions quickly: - Are we on schedule compared with the planned end? - How much of the estimated effort have we used, by stage and by role? - What is blocking us, and who owns it? ## Who it is for - PMs and delivery leads with several automation projects across clients or business units. - Teams that want a lightweight status page they can host for free and adapt by editing plain JavaScript. ## Features **Portfolio view** (weekly status of active projects) - Four PMO cards: **Health** (behind / at risk / on track / no planned end), **Hours** (projects over estimate and extra hours), **Schedule** (projects past their roadmap end and the worst variance) and **To decide** (open decisions and issues). - A table of active projects, sorted 🔴 → 🟡 → 🟢 by default, with: - a burn ring; - roadmap progress with a burn marker and the current stage; - the schedule badge; - the estimated end with its variance; - alerts calculated from the RAID log and hours; - a weekly comment. - Click a row to open the project. In Edit mode you can reorder rows (▲▼) and edit the comment. **Export PNG** downloads the table, dated, for a status report. **Account boards** (one per account, with status filter chips) - **Roadmap:** a gantt chart with Day and Week views, today's line, milestones, blockers (lost working days), project close marker and PNG export. - **Progress table:** for each stage, time elapsed on the roadmap vs. hours spent vs. manual progress %. - **Schedule metrics:** planned end, estimated end, schedule variance (days and %) and scope changes (count and day impact). - **Schedule badge:** 🟢 On track / 🟡 At risk / 🔴 Behind, plus Closed, No dates and No planned end. - **RAID log:** Actions, Risks, Issues, Decisions and Changes, with status, owner, due date, overdue flag, filters and a collapsible "Closed" list. - **Hours tab:** total burn, stage pills, one card per role (with a stage breakdown and team members), and a role × stage matrix. - **Runs, Docs and Links tabs:** production schedule, a delivery checklist, and backlog/estimate links. - **Comments:** a dated log per project. **Editing** (✏️ Edit button, bottom right) - Roadmap editor: add, remove and reorder stages, set dates, color and flag, and add blockers, milestones and close date. You can also set the planned end; changing it requires a reason, and each change is kept in a history. - Edit progress %, comments, docs checklist and links. RAID items can be added and edited at any time. - Portfolio: weekly comment per project and manual row order. - Every change is saved right away. Only UI-editable fields are saved; hours, roles and statuses always come from the data file. **Other** - Light and dark themes, following your system setting. - Configurable thresholds, stages, holidays, roles order and checklist in `config.js`. - Version history of saved edits, restorable from the browser console. ## Quick start 1. Download or clone the repository. 2. Open `index.html` in a browser. That's it. To use your own data, edit `data/projects.js` (see [docs/data-schema.md](docs/data-schema.md)). To change thresholds or stages, edit `config.js` (see [docs/metrics.md](docs/metrics.md)). To publish it, enable GitHub Pages on the repository (Settings → Pages → deploy from the `main` branch, root folder). ## Documentation - [Usage guide](docs/usage.md): navigation, editing, storage and restoring versions. - [Metrics](docs/metrics.md): every formula, threshold and how to read it. - [Data schema](docs/data-schema.md): how to load your own accounts and projects. - [Security](SECURITY.md): what this tool does not protect, and how to use it safely. ## Limitations - **No login and no permissions.** Anyone who can open the page can use Edit mode. - **No database: browser storage only.** Edits are saved in the visitor's browser (mock backend) and are not shared. Clearing the browser data deletes them. To share edits, connect your own database with authentication (see [Connecting your own database](docs/usage.md#connecting-your-own-database)). - **Hours are not editable from the UI.** Estimates, spent hours and roles are edited in `data/projects.js`. There is no import from timesheet tools. - **Project statuses are written by hand** in the data file (they drive the status filter); schedule levels and alerts are calculated. - **Saved roadmaps take priority.** Once a roadmap is edited from the UI, later changes to that project's roadmap in the data file are ignored until the saved data is cleared. - **Single file, no tests.** It is designed to be read and modified directly, not as a library. - Stage, month and day names are in English; there is no translation layer. ## Tech Plain HTML, CSS and JavaScript. No backend and no network calls (enforced by a Content-Security-Policy). External resources: Google Fonts and [html2canvas](https://html2canvas.hertzen.com/) for PNG export, pinned with an integrity hash. ## License [MIT](LICENSE) © Elena Miranda
Explore similar templates
Compare previews and descriptions within the same stack and category.
gentelella
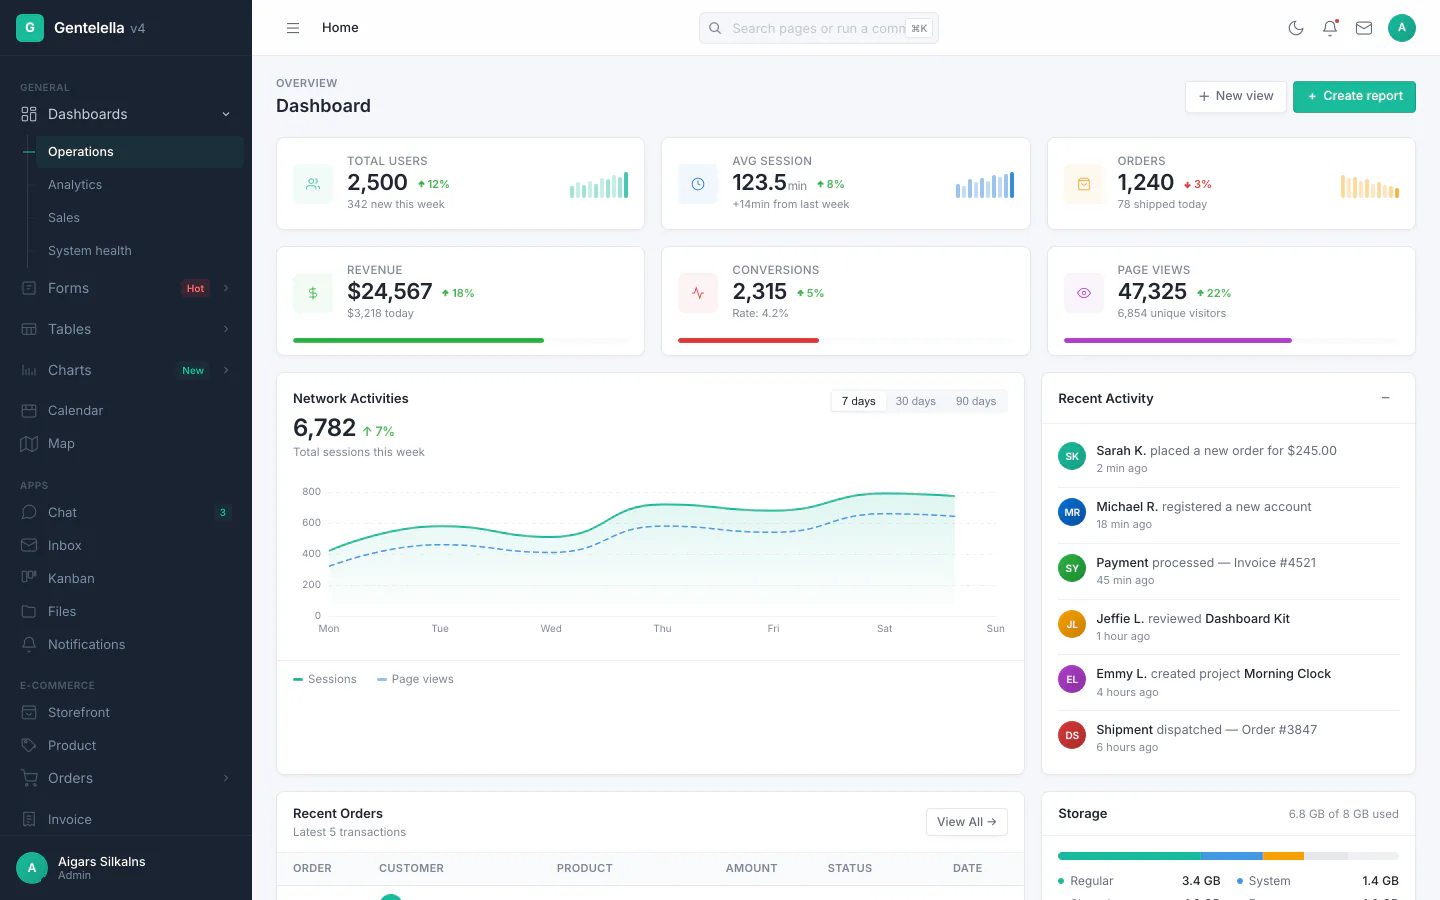
Gentelella v4 is a free, open-source admin dashboard template maintained by Colorlib, built with vanilla JavaScript, SCSS, and Vite 8 without Bootstrap or jQuery.
HTML · Admin dashboard
coreui-free-bootstrap-admin-template
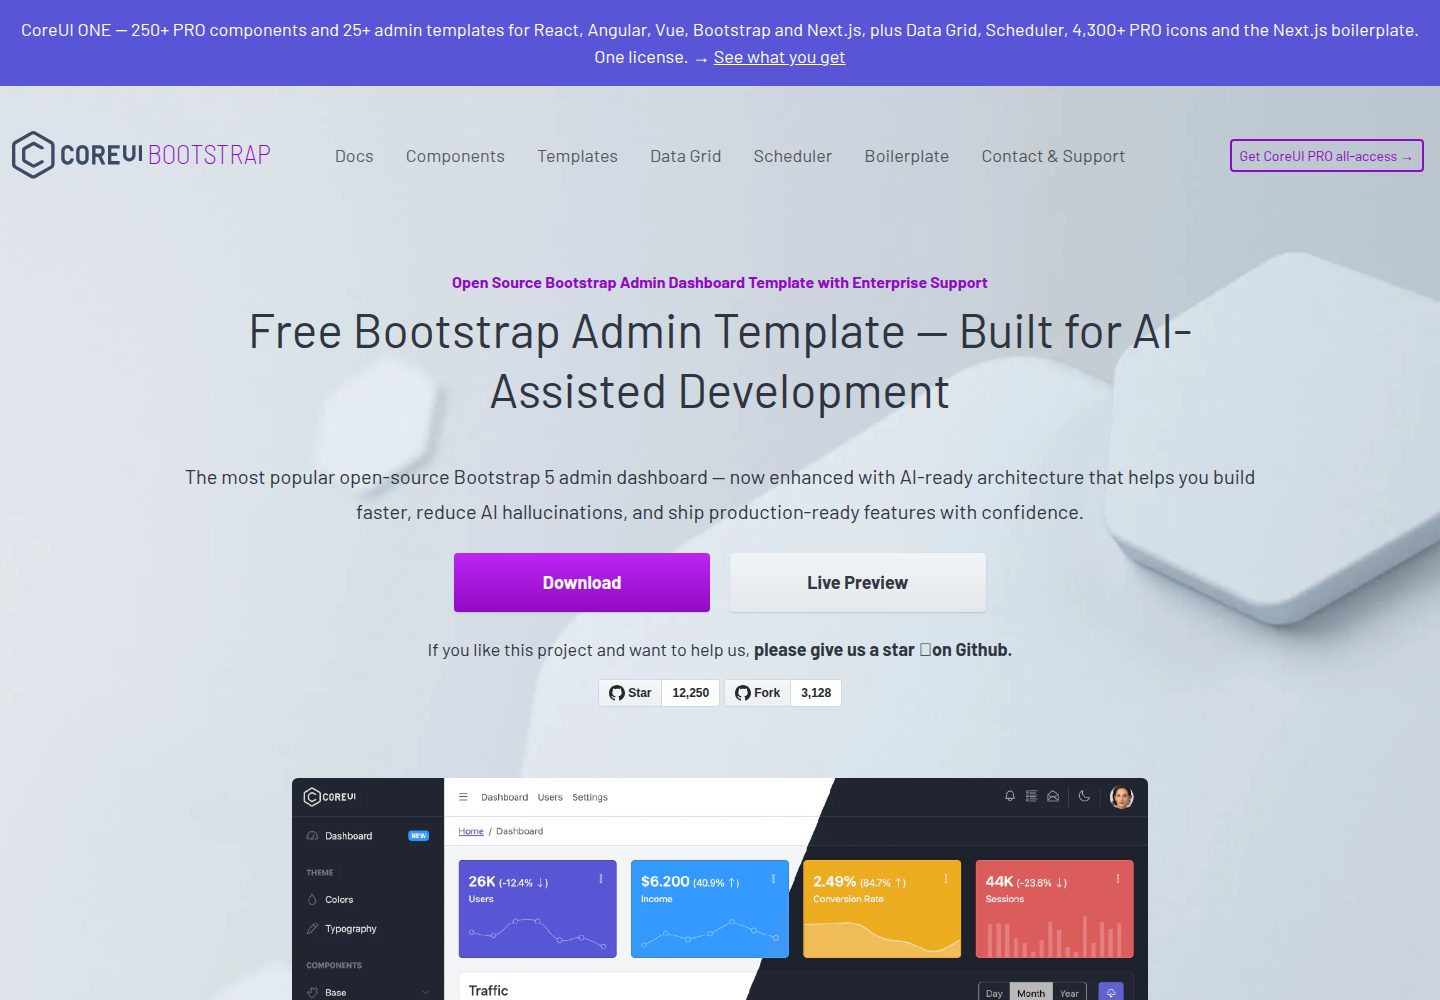
A free Bootstrap admin template maintained by CoreUI, built on CoreUI's own UI component library. It provides compiled HTML pages and Pug template source code, covering dashboards, authentication, forms, components, icons, and error pages.
HTML · Admin dashboard
dashboards
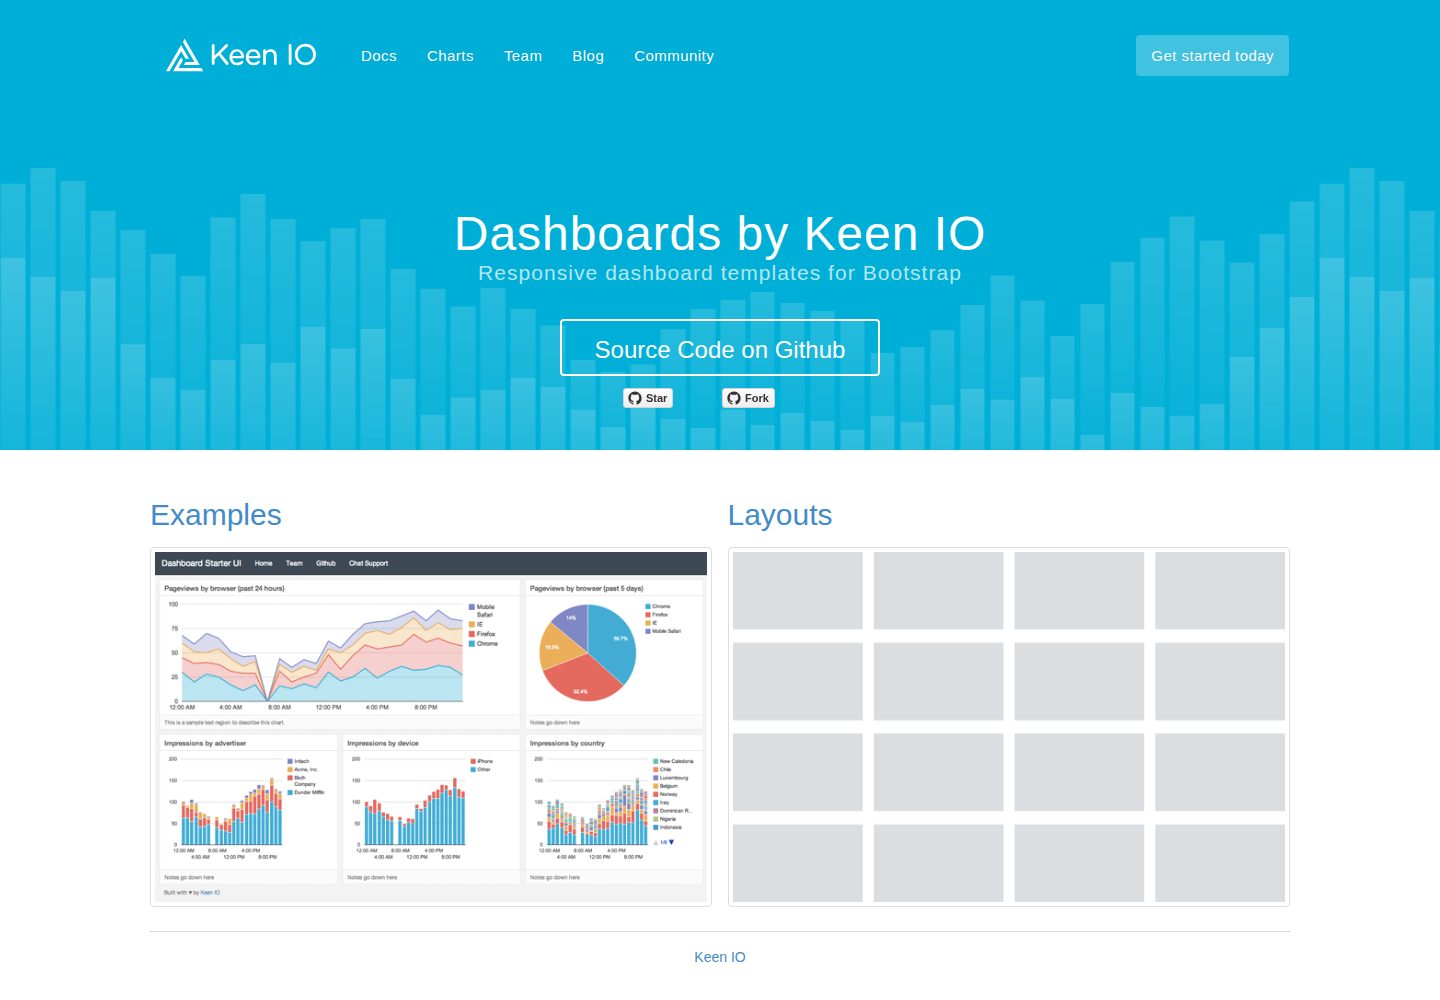
A collection of responsive dashboard HTML templates open-sourced by Keen IO, built on CSS Grid, offering multiple prebuilt admin data interface layouts.
HTML · Admin dashboard
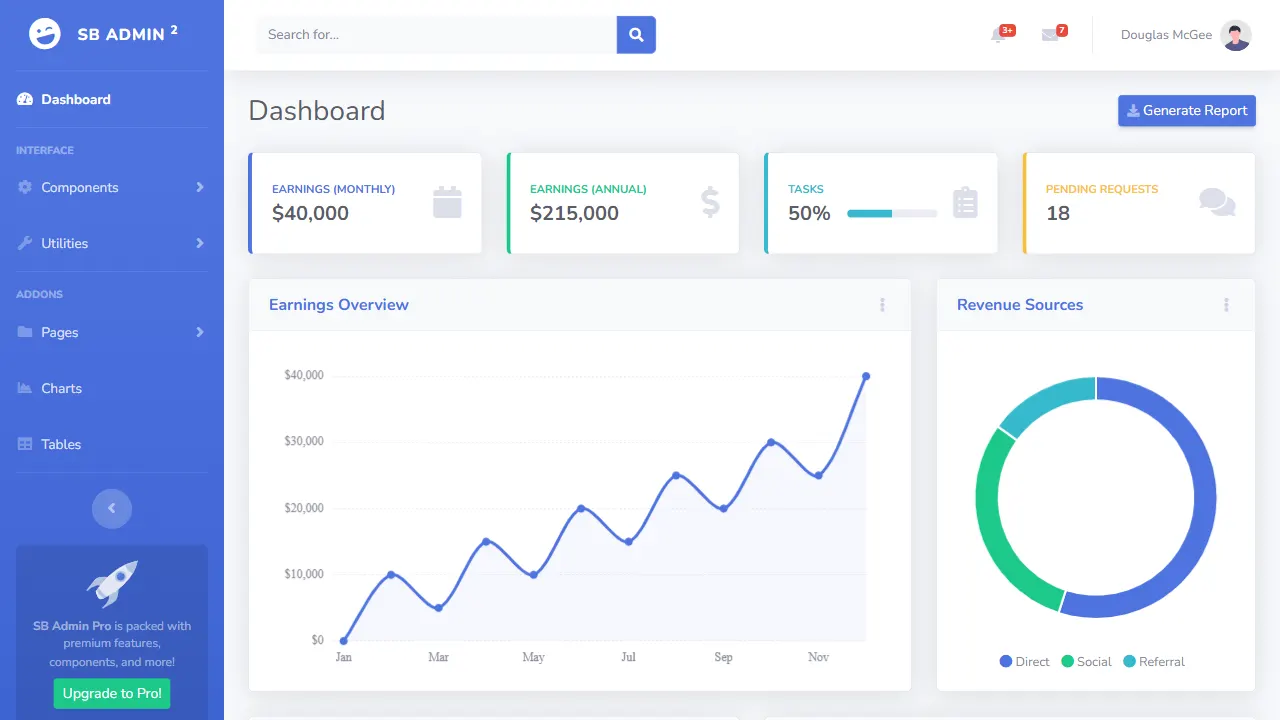
SB Admin 2
SB Admin 2 is a classic Bootstrap admin template from Start Bootstrap, offering dashboards, charts, tables, and common management pages.
HTML · Admin dashboard
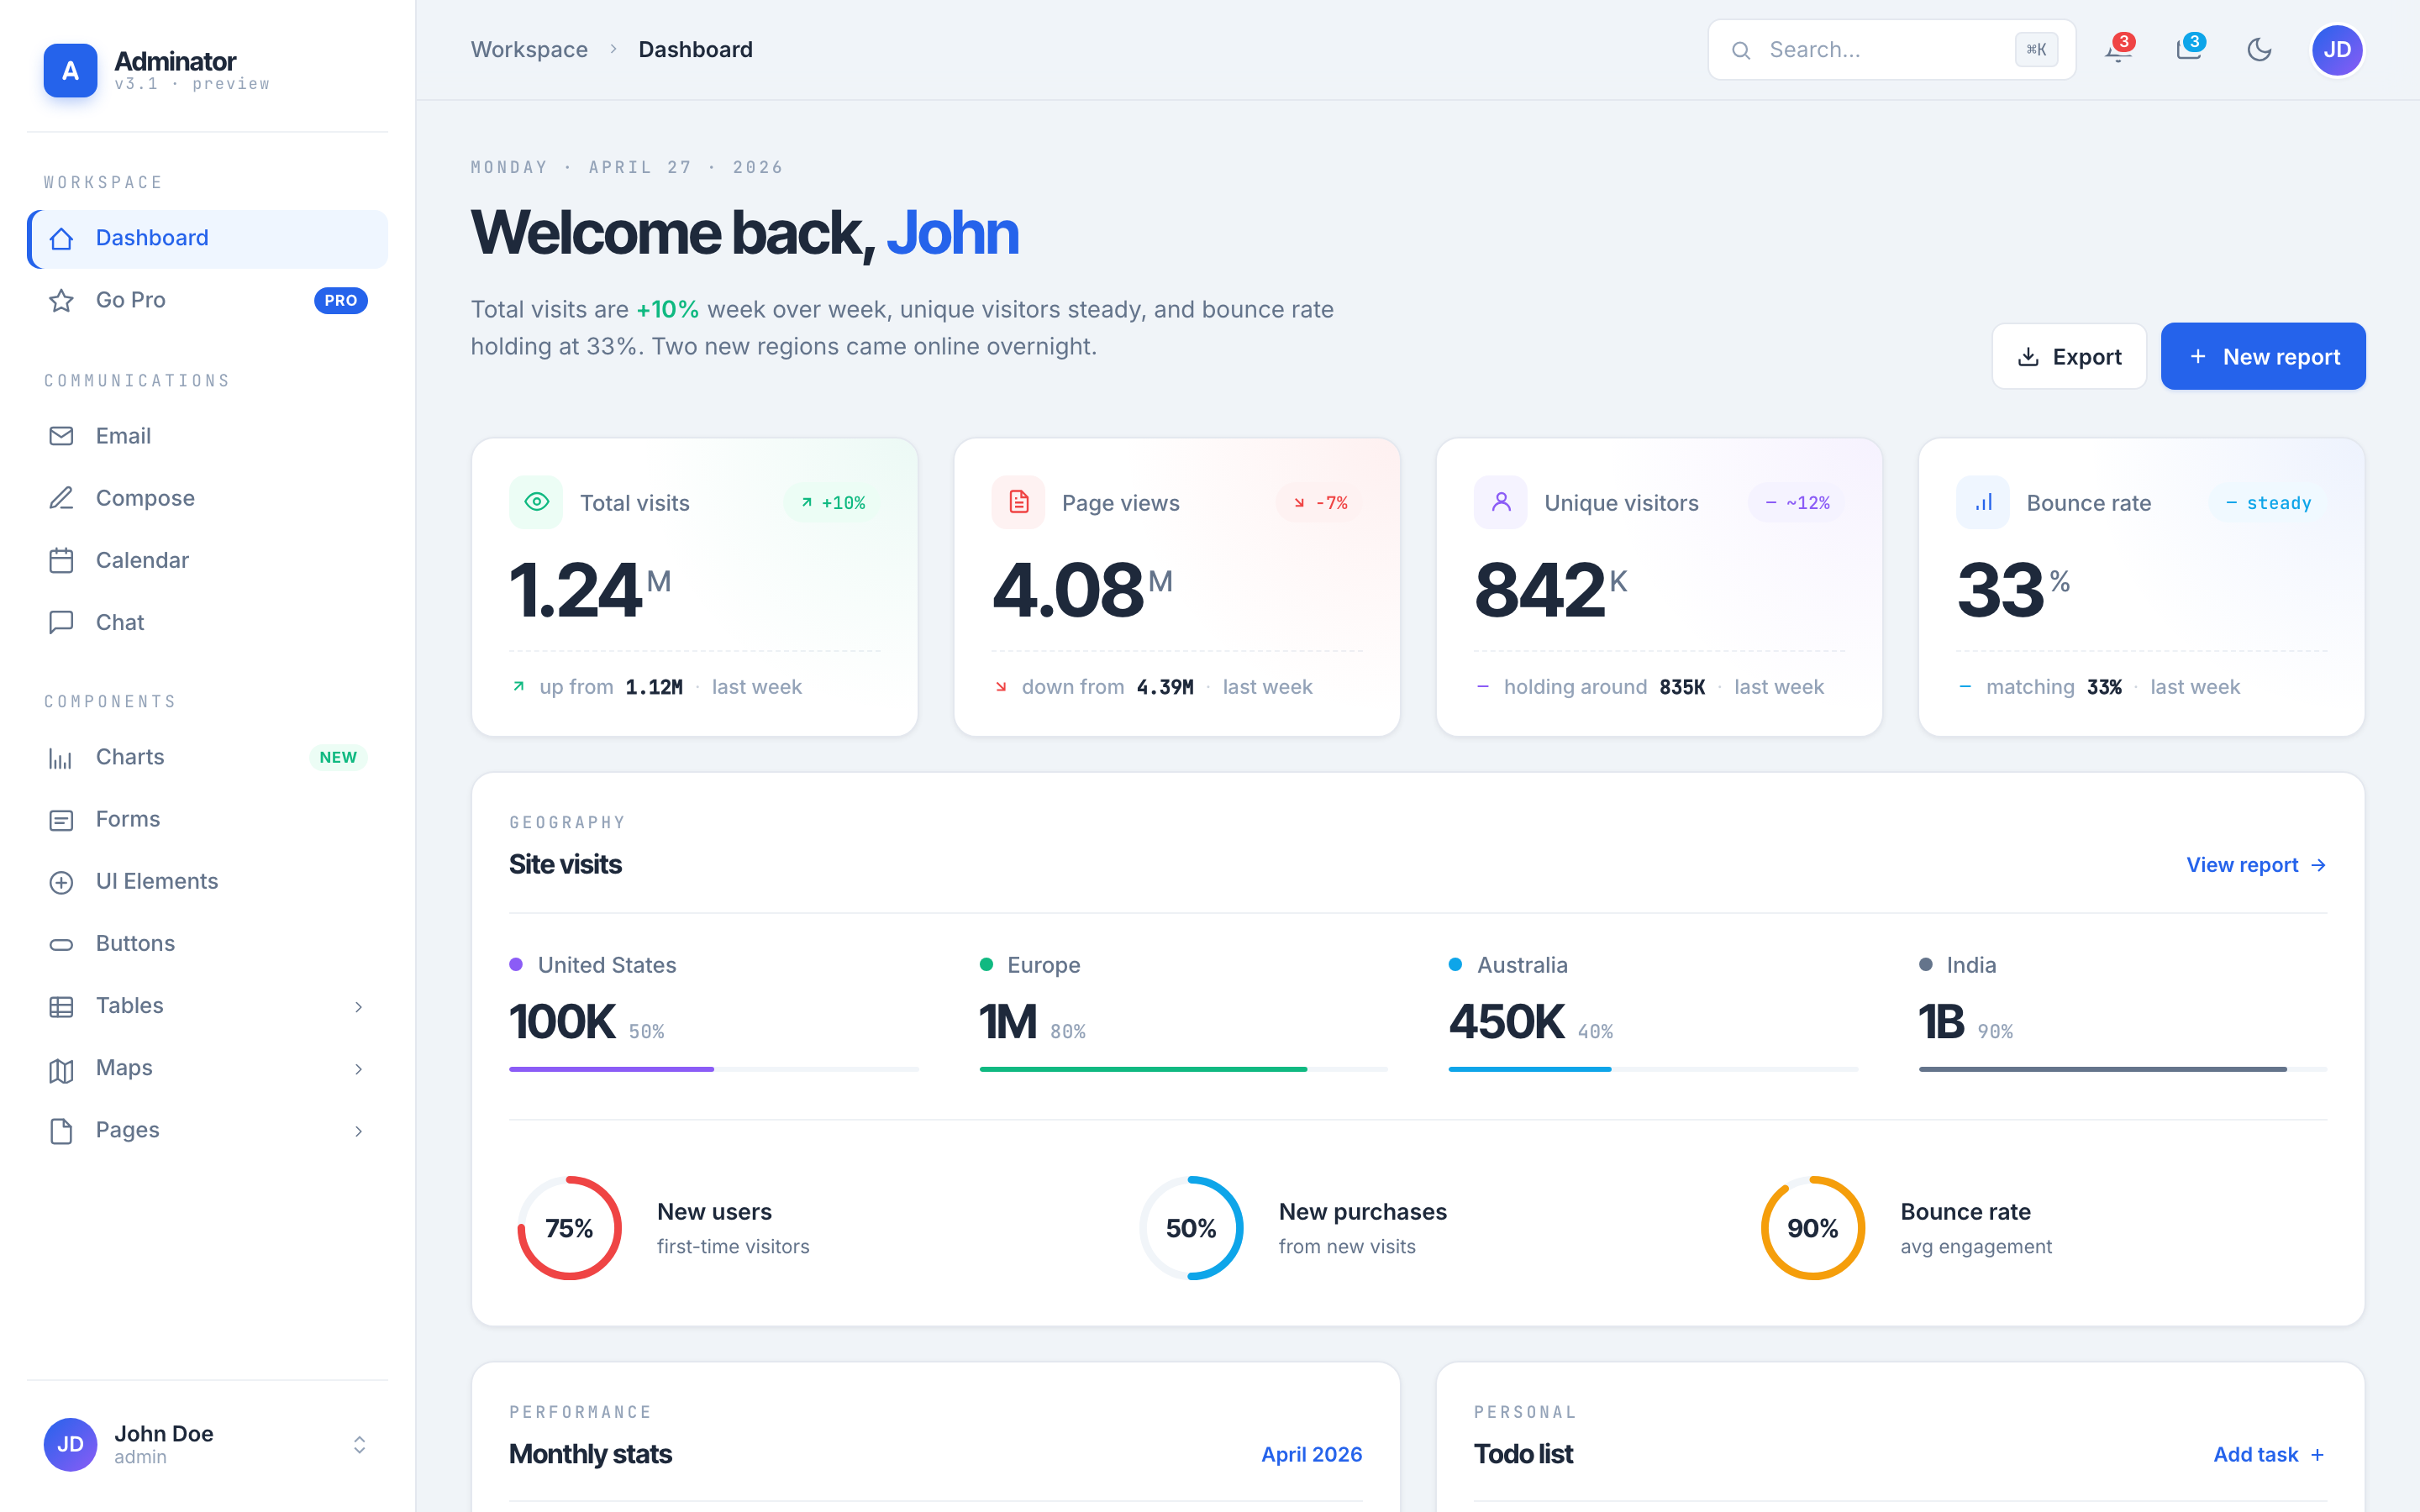
Adminator-admin-dashboard
Adminator 4 is a vanilla HTML, CSS and JavaScript admin dashboard template with a CSS-variable token design system, built-in light and dark themes, no jQuery or Bootstrap dependency, and 18 pages covering dashboards, mail, calendar, charts, forms, tables and error pages.
HTML · Admin dashboard
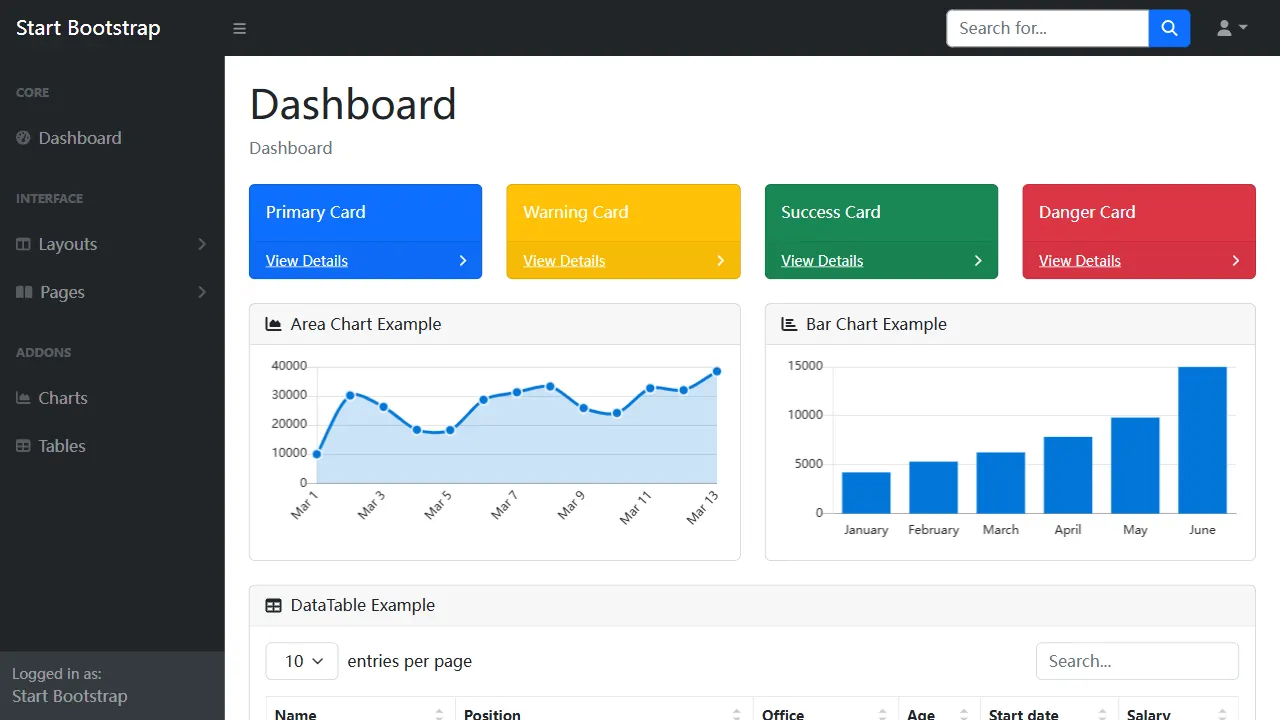
SB Admin
SB Admin is a lightweight, open-source Bootstrap admin template from Start Bootstrap. It offers a sidebar-and-top-bar layout with data tables, forms, and stat cards, plus responsive design.
HTML · Admin dashboard