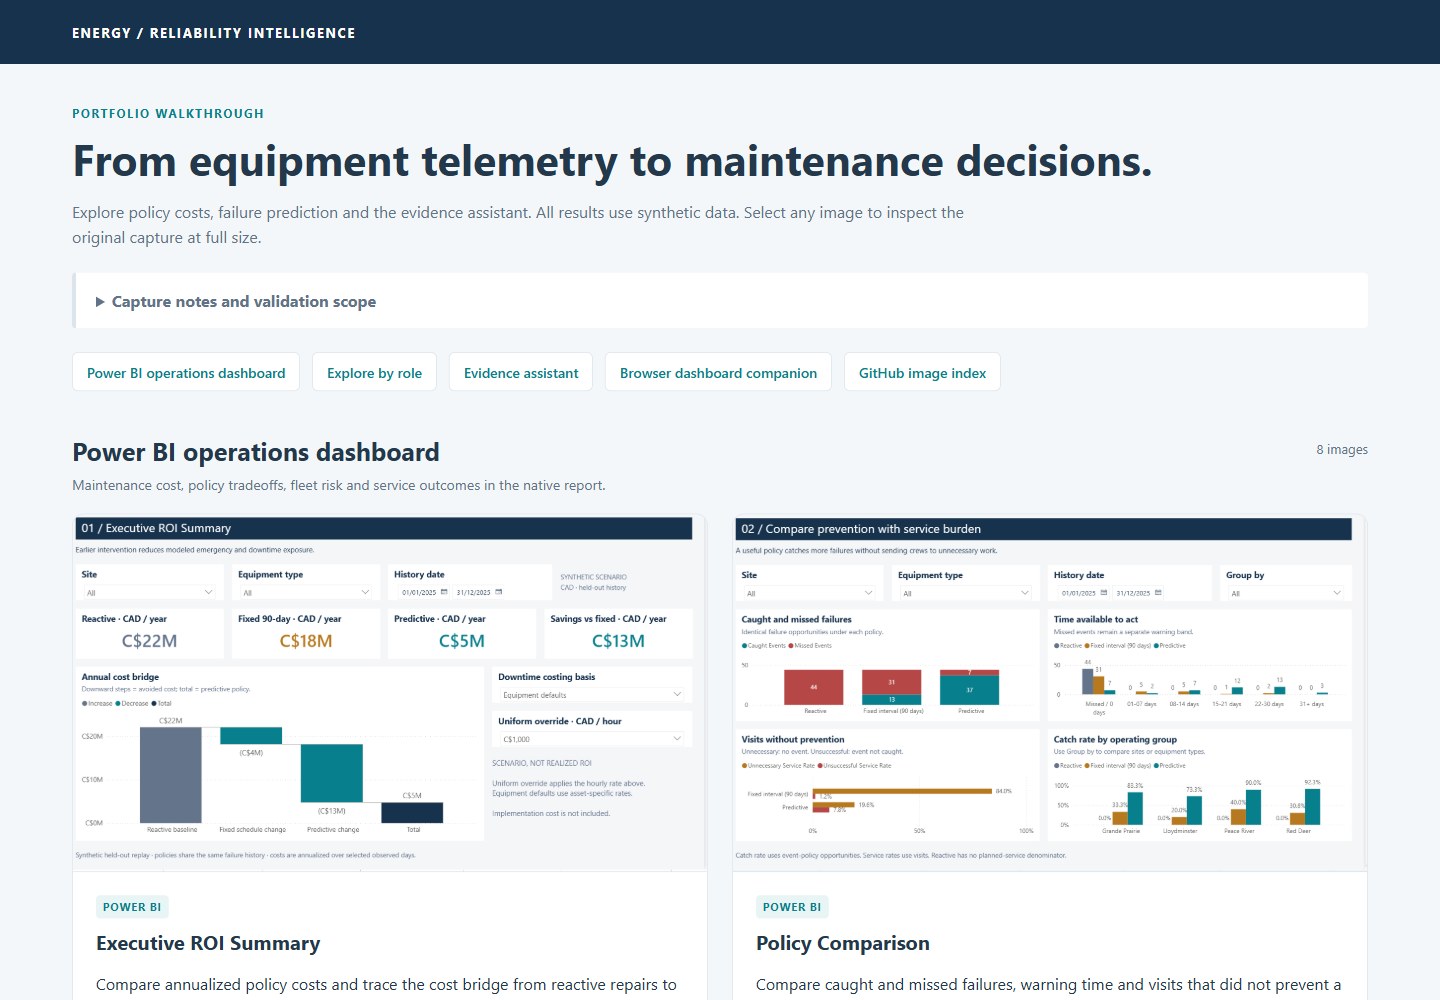
Uses synthetic SCADA-style telemetry data for 80 assets, 18 months, 43,760 daily snapshots and 236 failure events.
HTMLAdmin dashboard
oil-gas-equipment-predictive-maintenance — HTML Admin dashboard Template
By namarshi-data
A predictive-maintenance decision workflow based on synthetic SCADA telemetry data, using Python/SQL to compare the cost and downtime of reactive, fixed 90-day and predictive maintenance strategies, with a Power BI dashboard and a local evidence assistant.
Explore the design
Compare the page layouts and mobile experience. Open any screenshot for a closer look.
Desktop homepage1 / 2
Desktop captureTop of page
Rendered from the fixed source checkout.
All pages & views 2
Screenshots show visual appearance; interactive behavior may differ.
Recorded 2026-10-16View source
What stands out
A quick read of the recorded project description.
SQL cleaning removes 251 duplicate readings and flags 9,298 imputed sensor cells; features include 7/30-day means, rate of change and missing indicators.
Logistic regression and gradient boosting models are evaluated on 4,880 held-out asset-days; gradient boosting reaches average precision 0.931, precision 99.1% and recall 66.2%.
A 91-day replay compares reactive, fixed 90-day and predictive strategies on preventable/missed failures, planned visits, downtime hours and period cost.
Provides an editable Power BI project (TMDL/PBIR source, atomic fact star schema, 75 measures, six pages) and a local evidence assistant.
The README documents performance degradation and business-case reversal conditions under independent fleets, new equipment, missing maintenance, sensor faults and weaker interventions.
Template Details
The project centers on one business question: after accounting for unnecessary inspections, missed failures and downtime costs, does condition-based maintenance outperform calendar-based maintenance. The README states it uses synthetic Alberta scenario data for 80 pumps, compressors and pipeline pumps, covering 18 months, 43,760 daily snapshots and 236 failure events, with event frequency deliberately raised for testing.
The workflow includes: synthetic data generation, SQL cleaning and feature engineering (7/30-day means, rate of change, missing indicators and historical maintenance linkage), Python exploratory analysis, a 30-day failure prediction model (logistic regression and histogram gradient boosting, sharing a 38-feature whitelist, split by calendar with a 30-day label purge), strategy replay and cost accounting, plus a Power BI dashboard and a local evidence assistant. The README makes clear these are simulated results rather than field-validated savings, and that future sensor data is not regenerated after prevention, so this is transparent decision accounting rather than causal estimation.
On limitations, the README notes that the selected scorer is uncalibrated and outputs risk scores rather than failure probabilities or remaining useful life; the Azure deployment definitions are provided but not actually deployed, and cloud execution is unverified; the assistant uses a rule-based planner by default, and the demo identity is not production authentication; Power BI Desktop refresh, DAX interactions, mobile behavior and Service RLS still require independent acceptance.
HTMLBackend
Is it right for your project?
Use Cases
- Assess how condition-based maintenance strategies differ from fixed calendar maintenance in simulated cost and downtime.
- Study the feature engineering and time-series evaluation pipeline for building a 30-day failure classification model from daily telemetry.
- See how the Power BI dashboard organizes ROI, strategy, fleet risk, model performance and service audit pages.
- Test the site-wide evidence assistant's local evaluation performance under deterministic calculations, citations and injection attempts.
- Reproduce the full local pipeline of synthetic data generation, SQL cleaning, model evaluation and strategy replay.
Suitable For
- Data science and machine learning practitioners who want to understand predictive-maintenance decision accounting and strategy comparison methods.
- Engineers who need reference implementation details for SQL cleaning, feature engineering and time-series model evaluation.
- Business intelligence developers interested in the Power BI atomic fact star schema and how DAX measures are organized.
- Analysts studying model generalization limits and business-case sensitivity under synthetic telemetry data.
Getting started & customization
Use these recorded setup notes alongside the repository instructions for your chosen version.
- 1
The README requires Python 3.11+, creating a virtual environment in the project root and installing requirements.txt and the editable dev dependencies.
- 2
Run scripts/launch_local.py check for local checks, or use START_LOCAL.cmd to launch; on macOS/Linux replace .venv/Scripts/python with .venv/bin/python.
- 3
You can browse the screenshots directory without installation, or after extracting open reports/portfolio.html and reports/dashboard.html; GitHub only shows the HTML source, and the browser version does not execute DAX or RLS.
- 4
Azure deployment definitions are provided but not deployed; environment build, permissions, endpoint execution and GitHub-hosted CI remain external acceptance steps.
- 5
The README does not provide specific framework version numbers in the dependency list, and does not document production deployment steps.
License & source material
Usage conditions & limitations
Free to use · keep license noticeThis entry covers the free version of the public repository under the MIT license; the free scope is the code of this version and does not mean external services or third-party assets are free.
Must comply with when using
- Free use, modification, commercial use and distribution of this version's code are permitted.
- When distributing copies or substantial portions of the code, retain the original author's copyright notice and the complete MIT license notice.
- The code is provided as is; warranties and liability limitations are governed by the original license and applicable law.
Additional costs & items to verify
- Demo images, fonts, icons and other third-party assets must be checked against their own licenses and cannot be judged solely by the code's MIT license.
- External services such as domains, hosting, databases, payments or AI may incur separate charges.
- The README makes clear these are simulated results, not field-validated savings; the annual cost is an extrapolation from a deliberately failure-dense replay of the same fleet.
- Although Azure deployment definitions are provided, cloud execution has not been verified; only the local path is actually runnable.
- It uses simplified AER-style fields, does not use any operator or regulator telemetry data, and event frequency is deliberately raised for testing.
- Features are end-of-day features, not a real-time feature store.
- The selected scorer is uncalibrated and outputs a binary risk score rather than failure probability or remaining useful life; transferability to real equipment cannot be inferred from it.
- The table shows period totals rather than annual emergency repair costs; predictive maintenance can prevent 37/41 gradual failures but 0 of 3 sudden trips.
- The capacity study uses greedy heuristic scheduling, not route or labor optimization; the C$192,000/year program budget and C$75,000 implementation fee are scenario inputs, not actual incurred costs or quotes.
- Future sensor data is not regenerated after prevention, so this is transparent decision accounting rather than a causal estimate of field savings.
- On the three declared seeds, recall on independent fleets drops from 66.2% to 49.8%-55.5%; a single synthetic fleet overestimates transfer performance.
- New equipment has 0% recall on 150 positive asset-days; batch commissioning flags only request review and do not improve recall.
- Stuck-zero readings reduce recall for the affected cohort from 72.41% to 18.97%; in-scope failures can pass boundary checks, and no sensor diagnostic capability is established.
- Under a 14-day actionable window and 70% success rate, about C$884,454 is lost per year relative to fixed maintenance, and the modeled business case may reverse.
- No Azure resources are deployed; environment build, permissions, endpoint execution and GitHub-hosted CI remain external acceptance steps.
- Power BI Desktop refresh, DAX interactions, mobile behavior, actual viewer Service RLS and Key Influencers still require independent acceptance.
- The assistant uses a rule-based planner by default, and the demo identity is not production authentication; optional function calling has only simulated tests, with no live model evaluation, and Copilot is not integrated.
View Original Text Basis
Permission is hereby granted, free of charge
Original License Text
**Simulation results, not field-validated savings.** Annual costs extrapolate a deliberately failure-rich replay of the same fleet. Gross avoided repairs are already included in operating savings; incremental program costs are considered separately.
Original README
The solid path runs locally. The Azure deployment definitions are supplied; cloud execution remains unvalidated.
Original README
[Source mapping](docs/sources.md) and the [data dictionary](docs/data_dictionary.md) document simplified AER-inspired fields. No operator or regulator telemetry is used; event frequency is intentionally enriched for testing.
Original README
[Causal cleaning](sql/01_clean.sql) deduplicates records, validates ranges and imputes from earlier valid observations. [Features](sql/02_features.sql) include 7/30-day means, change rates, missingness indicators and historical maintenance joins. These are end-of-day features, not a real-time feature store.
Original README
The selected scorer is **uncalibrated**. It produces risk scores for binary classification, not established failure probabilities or remaining useful life. Separate calibration experiments and conditional asset-bootstrap intervals are reported in [generalization](docs/generalization.md); they do not establish transfer to real equipment.
Original README
**These are period totals, not annual emergency-repair costs.** They include planned service, emergency repairs and planned/unplanned downtime. [Event outcomes](data/processed/dashboard/event_outcomes.csv) and [service visits](data/processed/dashboard/service_visits.csv) expose misses and unproductive interventions. Predictive service prevents 37/41 gradual failures and 0/3 abrupt trips, which the generator defines as unpreventable.
Original README
The [capacity study](docs/operations.md) applies equal weekly limits: at three planned visits/week, predictive prevention falls to 30/44 versus 7/44 for fixed servicing. Booking uses a greedy heuristic, not route or workforce optimization. An illustrative C$192,000/year program budget plus C$75,000 implementation gives C$13.23M recurring and C$13.15M first-year savings. These are scenario inputs, not incurred costs or quotes.
Original README
Future sensors are not regenerated after prevention. This is transparent decision accounting, not a causal estimate of field savings. [Methodology](docs/methodology.md)
Original README
| [Independent fleets](docs/generalization.md) | Recall falls from 66.2% to 49.8%-55.5% across three declared seeds. | One synthetic fleet overstates transfer performance. |
Original README
| [New equipment](docs/robustness.md) | Six fixtures: 0% recall across 150 positive asset-days. | Batch commissioning flags request review; they do not improve recall. |
Original README
| [Sensor faults](docs/sensor-fault-tests.md) | Stuck-zero readings lower affected-cohort recall from 72.41% to 18.97%. | In-range faults pass bounds checks; no sensor diagnosis is established. |
Original README
| [Weaker interventions](reports/sensitivity.csv) | At 14 actionable days and 70% success: approximately C$884,454/year loss versus fixed. | The modeled business case can reverse. |
Original README
No Azure resources are deployed. Environment builds, permissions, endpoint execution and GitHub-hosted CI remain external acceptance steps. [Engineering evidence](docs/mlops.md)
Original README
Local validation covers Microsoft parsing, schemas, bindings and independent ledger arithmetic. Native screenshots show visible output; Desktop refresh, DAX interactions, mobile behavior, actual-viewer Service RLS and Key Influencers still require independent acceptance.
Original README
https://github.com/namarshi-data/oil-gas-equipment-predictive-maintenance/blob/main/LICENSEhttps://github.com/namarshi-data/oil-gas-equipment-predictive-maintenance/blob/main/README.mdThe [assistant](docs/ai-assistant.md) queries authorized records with deterministic calculations and citations. **41/41 local evaluation cases** cover grounding, unsupported questions, cross-site access and injection attempts. Its default planner is rules-based; the demonstration identity is not production authentication. Optional function calling has mock tests but no live-model evaluation. Copilot is not integrated.
Original README
Compiled by DeepSeek based on repository license and README ·2026-10-15. Results only cover the materials read; dependencies, images, fonts, and subsequent term changes are subject to their respective original texts.
Project checks & description sources
Template Information
- Source platforms
- GitHub
- Documentation and maintenance reference score
- Partly documented · 68 / 100
- Technologies
- HTML
- Website type
- Admin dashboard
How this score is calculated
Our heuristic uses license records (up to 30), a demo link (12), a preview (10), stars (15), recorded maintenance (15), description completeness (8), feature records (5) and classification data (5). It is not a code, security or performance test, or a Google score. A link does not establish tested functionality.
What to verify for this project
- Repository update recorded
- 2026-09-21
- Screenshot last checked
- 2026-10-16
No demo link is recorded. Use the repository instructions to evaluate the project locally; the screenshot alone cannot establish interactive behavior.
The catalog identifies HTML as the primary stack. Check the actual dependency manifest and lockfile for versions and hosting requirements. These notes use recorded metadata, not a code audit or a deployment test.
Use a selection guide →How this description was prepared
AI-assisted description based on catalog records and repository material. Repository authors are not automatically the reviewers of this description.
Review declaration: codex-user-requested-batch-review-20261017 · 2026-10-16
Inspect the recorded source material
SHA-256: 1a37bfc320c8d0360003e7cf246bc9d9fa742b83fefe4c5a2fa8859bf6439333
2026-10-15T13:34:53.533Z
Source file / repository<!-- PORTFOLIO_HEADLINE:START -->
# Predictive Maintenance for Oil & Gas Operations
A reproducible maintenance decision workflow that classifies **next-30-day equipment failure** from **daily synthetic SCADA-style telemetry**, then compares predictive service with reactive repairs and fixed 90-day servicing.
*Synthetic Alberta-inspired scenario · 80 assets · 18 months of history · 91-day held-out replay · CAD estimates*
**Simulation results, not field-validated savings.** Annual costs extrapolate a deliberately failure-rich replay of the same fleet. Gross avoided repairs are already included in operating savings; incremental program costs are considered separately.
- **C$13.42M/year modeled operating savings vs. current fixed-interval maintenance.**
- **82.0% less unplanned downtime vs. current fixed-interval maintenance** (90-day servicing).
- **19-day median warning vs. current reactive maintenance's 0 days**, among 37 of 44 failures caught in simulation.
- **C$4.93M/year modeled emergency-repair avoidance vs. current reactive maintenance** (an included cost component).
    
<img src="reports/figures/failure_warning_summary.png" width="860" alt="Failure warning distribution for reactive, fixed 90-day and predictive maintenance on the same synthetic history; missed events are retained in the first band.">
<!-- PORTFOLIO_HEADLINE:END -->
**The business decision:** does condition-driven maintenance outperform the service calendar once unnecessary visits, missed failures and downtime are costed?
[Visual evidence](#visual-evidence) · [Policy comparison](#5-maintenance-policy-and-business-case) · [Failure findings](#failure-modes-and-measured-limits) · [Quick start](#quick-start) · [Full technical walkthrough](docs/technical-walkthrough.md)
## Review by role
| Role | Evidence to inspect |
|---|---|
| **Data Scientist** | [Model card](docs/model-card.md): causal features, temporal evaluation and validation-only threshold selection. [Generalization](docs/generalization.md): independent fleets, calibration and uncertainty. |
| **ML Engineer** | [Operating design](docs/mlops.md): provenance, batch-contract validation, quality advisories, mature-label monitoring and deployment gates. |
| **AI Engineer** | [Evidence assistant](docs/ai-assistant.md): site-scoped queries, deterministic calculations, citations and authorization/injection evaluations. |
| **Power BI / Analytics** | [Dashboard guide](docs/powerbi.md): atomic facts, filter-aware DAX, dynamic site RLS and reporting acceptance checks. |
### Visual evidence
| Power BI: Executive ROI | Assistant: policy comparison |
|---|---|
| [](screenshots/powerbi-native/01-executive-roi.png) | [](screenshots/assistant/01-policy-comparison-after.jpg) |
The [gallery](screenshots/README.md) distinguishes native Power BI output from browser demonstrations and records capture limitations.
## System architecture
```mermaid
flowchart LR
A[Daily synthetic telemetry and maintenance] --> B[Causal SQL cleaning and features]
B --> C[Temporal model evaluation and daily risk scores]
C --> D[Policy replay and cost accounting]
D --> E[Event and service ledgers]
E --> F[Power BI and HTML dashboard]
E --> G[Site-scoped evidence assistant]
C --> G
C -. Proposed cloud execution .-> H[Azure ML registry and batch endpoint]
```
The solid path runs locally. The Azure deployment definitions are supplied; cloud execution remains unvalidated.
## 1. Business problem and synthetic equipment data
[Synthetic generation](src/energy_failure/synthetic.py) produces 80 pumpjacks, compressors and pipeline pumps at fictional Alberta sites: 18 months, 43,760 daily snapshots and 236 failure events. Degradation, seasonality, noise, communication outages and invalid readings exercise the workflow.
[Source mapping](docs/sources.md) and the [data dictionary](docs/data_dictionary.md) document simplified AER-inspired fields. No operator or regulator telemetry is used; event frequency is intentionally enriched for testing.
## 2. SQL cleaning and feature engineering
[Causal cleaning](sql/01_clean.sql) deduplicates records, validates ranges and imputes from earlier valid observations. [Features](sql/02_features.sql) include 7/30-day means, change rates, missingness indicators and historical maintenance joins. These are end-of-day features, not a real-time feature store.
The reference run removes 251 duplicate readings and flags 9,298 imputed sensor cells. [Quality counts](data/processed/cleaning_quality.json) reconcile raw and cleaned output.
## 3. Python exploratory analysis
The [EDA notebook](notebooks/01_explore.ipynb) examines training-period degradation and sensor relationships. Held-out business plots are labelled separately. Rising vibration and temperature reflect the generator's programmed patterns, so they are not a field discovery. The [technical walkthrough](docs/technical-walkthrough.md) retains figures, experiment design and debugging examples.
## 4. Thirty-day failure prediction
Logistic regression and histogram gradient boosting share a 38-feature allowlist excluding identifiers, future outcomes, costs and oracle state. Calendar splits use 30-day label purges. Model and threshold selection minimize **validation policy cost among the tested candidates**.
<!-- PORTFOLIO_MODELS:START -->
| Model | Selected threshold | Average precision | Precision | Recall | Brier score |
|---|---:|---:|---:|---:|---:|
| Logistic regression | 0.85 | 0.909 | 96.3% | 58.7% | 0.043 |
| **Gradient boosting** | 0.90 | 0.931 | 99.1% | 66.2% | 0.036 |
<!-- PORTFOLIO_MODELS:END -->
Both models are evaluated on 4,880 held-out asset-days in April-May 2025. June's incomplete labels are excluded from classification metrics; policy evaluation counts observed events through June. Daily recall differs from event prevention because multiple positive days can precede one failure.
The selected scorer is **uncalibrated**. It produces risk scores for binary classification, not established failure probabilities or remaining useful life. Separate calibration experiments and conditional asset-bootstrap intervals are reported in [generalization](docs/generalization.md); they do not establish transfer to real equipment.
## 5. Maintenance policy and business case
All policies share the same 91-day history. Fixed servicing follows installation dates plus 90-day intervals, including eligible pre-period visits. Predictive servicing dispatches two days after an alert and applies a 30-day cooldown. Both intervention policies use a 30-day actionable window and 90% success assumption.
<!-- PORTFOLIO_POLICIES:START -->
| Policy | Prevented / missed failures | Planned visits in period | Unplanned hours | Total downtime hours | Total period cost, CAD |
|---|---:|---:|---:|---:|---:|
| Reactive | 0 / 44 | 0 | 3,877.0 | 3,877.0 | C$5,505,868 |
| Fixed 90-day | 13 / 31 | 81 | 2,607.1 | 3,093.1 | C$4,527,234 |
| Predictive | 37 / 7 | 51 | 469.0 | 771.0 | C$1,183,653 |
<!-- PORTFOLIO_POLICIES:END -->
**These are period totals, not annual emergency-repair costs.** They include planned service, emergency repairs and planned/unplanned downtime. [Event outcomes](data/processed/dashboard/event_outcomes.csv) and [service visits](data/processed/dashboard/service_visits.csv) expose misses and unproductive interventions. Predictive service prevents 37/41 gradual failures and 0/3 abrupt trips, which the generator defines as unpreventable.
The [capacity study](docs/operations.md) applies equal weekly limits: at three planned visits/week, predictive prevention falls to 30/44 versus 7/44 for fixed servicing. Booking uses a greedy heuristic, not route or workforce optimization. An illustrative C$192,000/year program budget plus C$75,000 implementation gives C$13.23M recurring and C$13.15M first-year savings. These are scenario inputs, not incurred costs or quotes.
Future sensors are not regenerated after prevention. This is transparent decision accounting, not a causal estimate of field savings. [Methodology](docs/methodology.md)
### Failure modes and measured limits
| Challenge | Measured finding | Interpretation |
|---|---|---|
| [Independent fleets](docs/generalization.md) | Recall falls from 66.2% to 49.8%-55.5% across three declared seeds. | One synthetic fleet overstates transfer performance. |
| [New equipment](docs/robustness.md) | Six fixtures: 0% recall across 150 positive asset-days. | Batch commissioning flags request review; they do not improve recall. |
| [Missing maintenance](docs/robustness.md) | Removing alternating repairs raises false positives from 5 to 14. | Missing history changes decisions. |
| [Sensor faults](docs/sensor-fault-tests.md) | Stuck-zero readings lower affected-cohort recall from 72.41% to 18.97%. | In-range faults pass bounds checks; no sensor diagnosis is established. |
| [Weaker interventions](reports/sensitivity.csv) | At 14 actionable days and 70% success: approximately C$884,454/year loss versus fixed. | The modeled business case can reverse. |
## 6. Azure ML pipeline and batch scoring
[Deployment definitions](deployment/) cover infrastructure, training/evaluation, registration, batch scoring and candidate validation before promotion. Local batch checks reconcile **7,280 predictions**, including complete unique row coverage, identities, scores and metadata. [Provenance](artifacts/provenance.json) and mature-label monitoring support auditability.
No Azure resources are deployed. Environment builds, permissions, endpoint execution and GitHub-hosted CI remain external acceptance steps. [Engineering evidence](docs/mlops.md)
## 7. Power BI dashboard and evidence assistant
The editable [Power BI project](powerbi/EnergyPredictiveMaintenance.pbip) uses TMDL/PBIR source, an atomic-fact star schema and 75 documented measures. Six visible pages cover ROI, policies, fleet risk, model performance, service audit and methodology.
Local validation covers Microsoft parsing, schemas, bindings and independent ledger arithmetic. Native screenshots show visible output; Desktop refresh, DAX interactions, mobile behavior, actual-viewer Service RLS and Key Influencers still require independent acceptance.
The [assistant](docs/ai-assistant.md) queries authorized records with deterministic calculations and citations. **41/41 local evaluation cases** cover grounding, unsupported questions, cross-site access and injection attempts. Its default planner is rules-based; the demonstration identity is not production authentication. Optional function calling has mock tests but no live-model evaluation. Copilot is not integrated.
## Quick start
**No installation:** browse the [screenshots](screenshots/README.md). After extracting, open [reports/portfolio.html](reports/portfolio.html) or [reports/dashboard.html](reports/dashboard.html). GitHub displays HTML source; the browser companion does not execute DAX or RLS.
For Python 3.11+, run from the extracted project root on Windows:
```powershell
python -m venv .venv
.venv/Scripts/python -m pip install -r requirements.txt
.venv/Scripts/python -m pip install -e ".[dev]"
.venv/Scripts/python scripts/launch_local.py check
```
Then use [START_LOCAL.cmd](START_LOCAL.cmd), or launch the assistant with `.venv/Scripts/python scripts/launch_local.py assistant`. On macOS/Linux, replace `.venv/Scripts/python` with `.venv/bin/python`.
To reproduce the reference analysis, run `.venv/Scripts/python -m energy_failure.pipeline --output-root .`, then `.venv/Scripts/python scripts/build_readme.py`. Regeneration replaces generated outputs. [START_HERE.md](START_HERE.md) covers the full studies and checks; [LOCAL_SETUP.md](LOCAL_SETUP.md) covers notebooks and Power BI path configuration. Reference artifacts and demo facts are included; raw/training data are [generated locally](data/README.md).
[Validation record](reports/validation.md) · [Full technical walkthrough](docs/technical-walkthrough.md) · [MIT license](LICENSE)
## About the author
I'm **Namarshi Palit**, seeking **Data Scientist, ML Engineer or AI Engineer** opportunities in **Alberta**. I focus on turning operational data into rigorously evaluated models, traceable decisions and practical tools, and aim to join a team solving real operational problems through data and AI.
[LinkedIn](https://www.linkedin.com/in/namarshi-palit-1a9534186) · [GitHub](https://github.com/namarshi-data) · [Email](mailto:[email protected])
Explore similar templates
Compare previews and descriptions within the same stack and category.
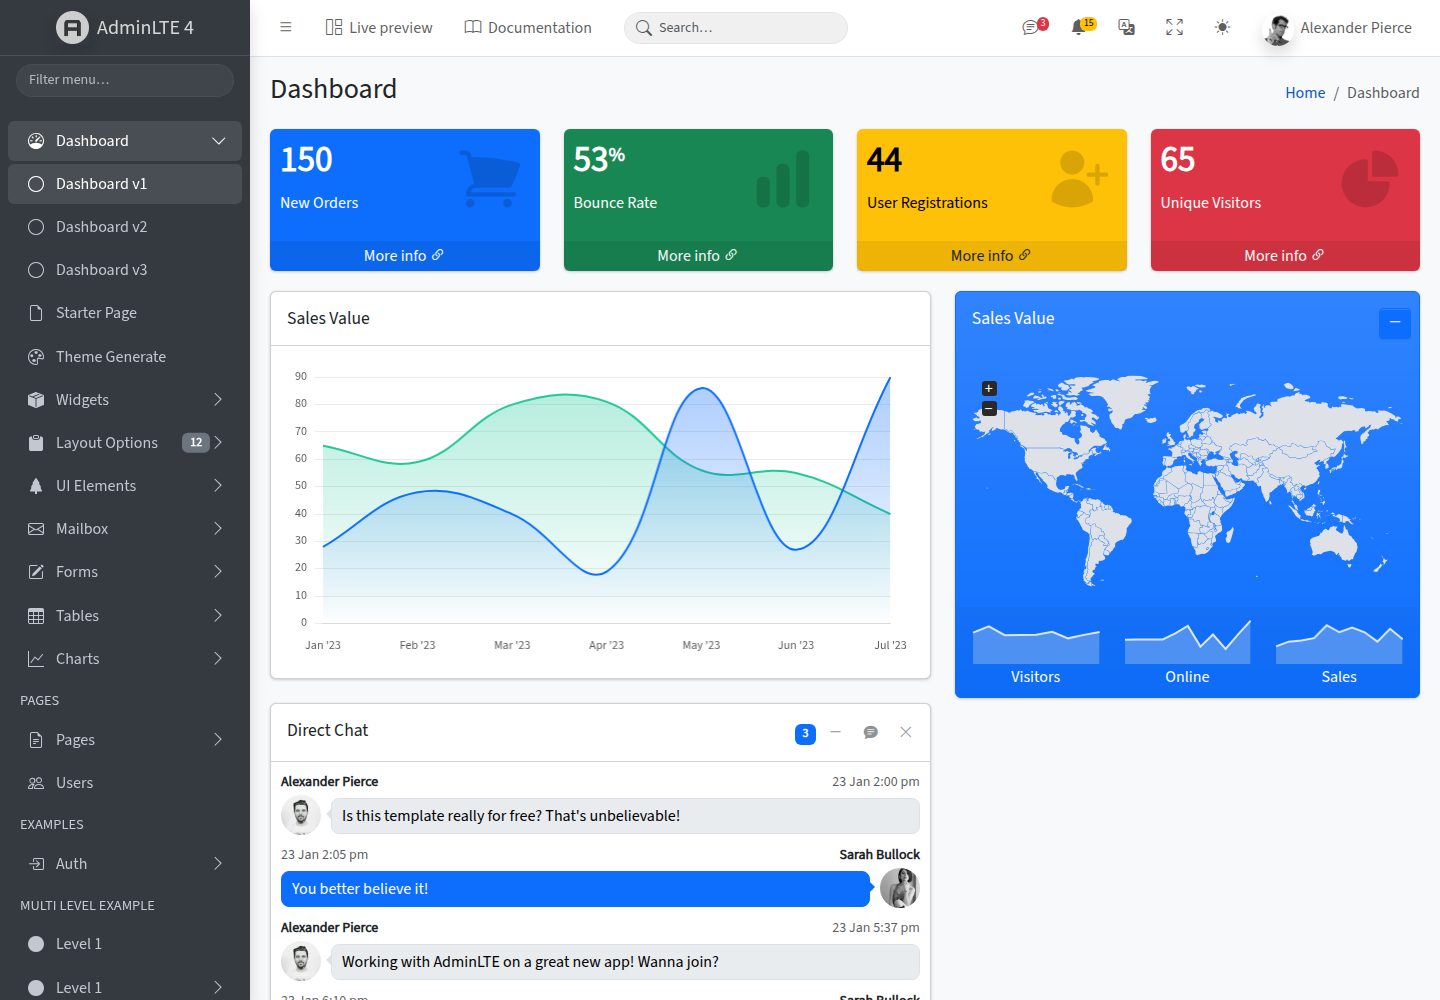
AdminLTE
An HTML admin dashboard built with Bootstrap 5 and vanilla JavaScript. Astro builds the documentation; React, Vue and Angular editions live in separate repositories.
HTML · Admin dashboard
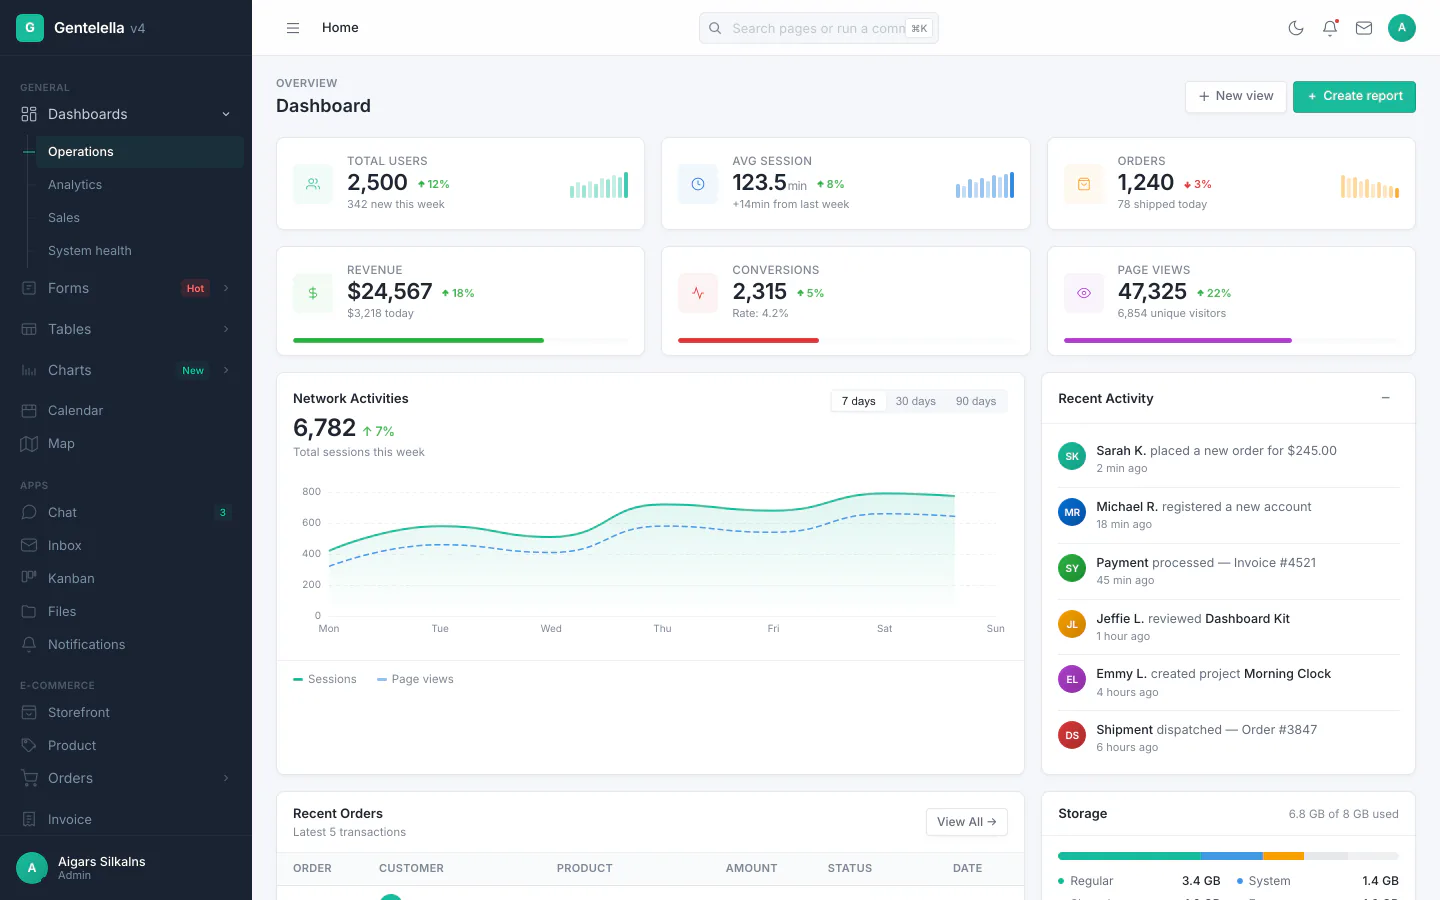
gentelella
Gentelella v4 is a free, open-source admin dashboard template maintained by Colorlib, built with vanilla JavaScript, SCSS, and Vite 8 without Bootstrap or jQuery.
HTML · Admin dashboard
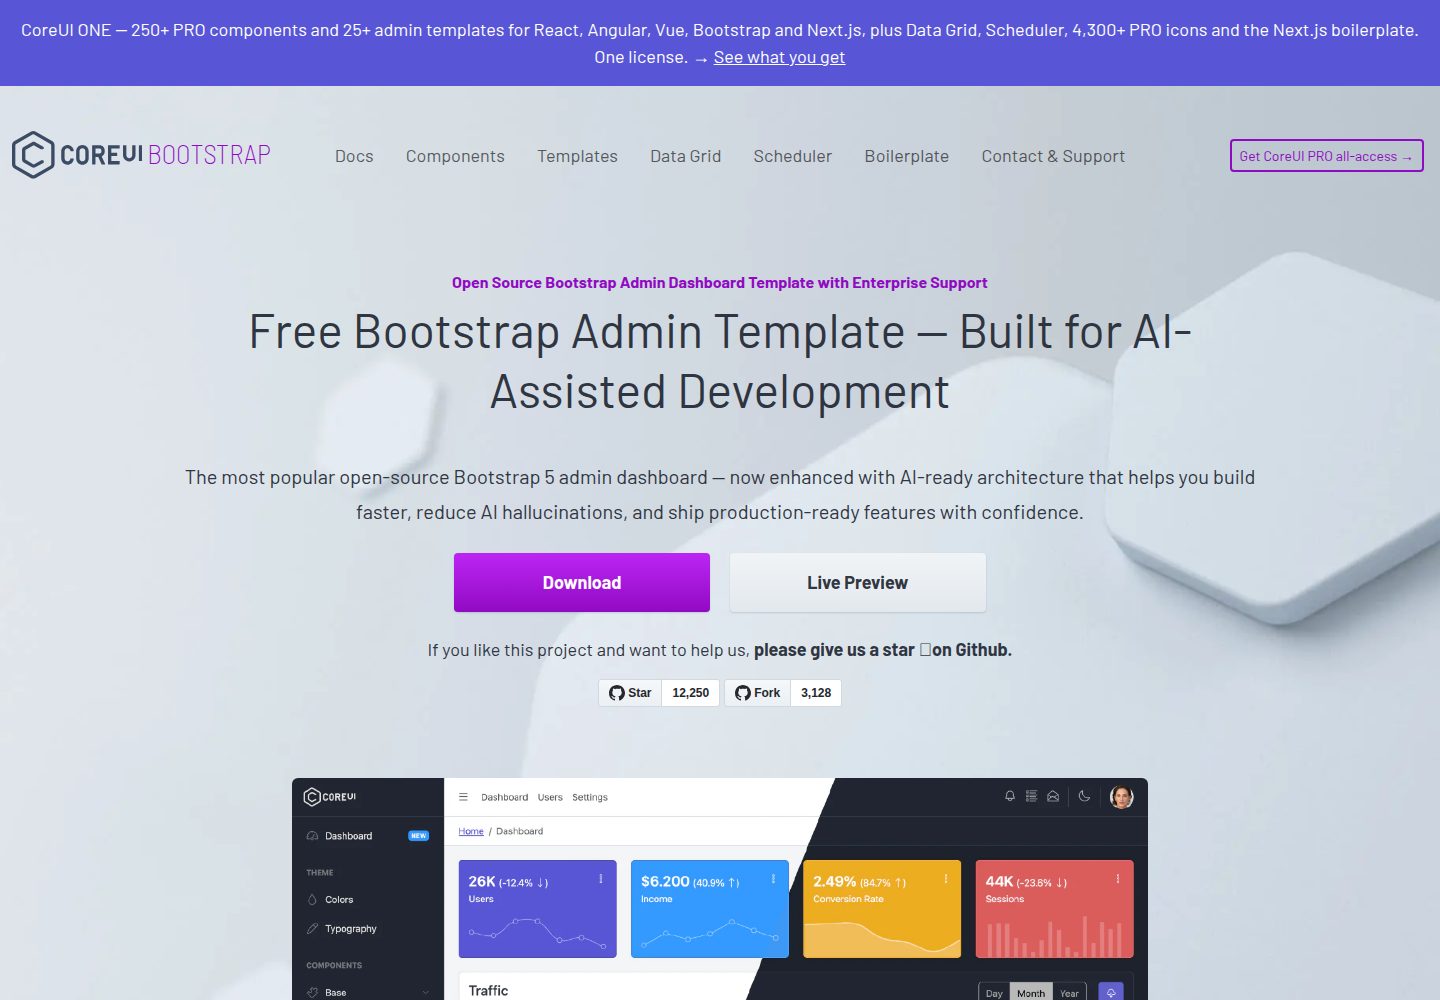
coreui-free-bootstrap-admin-template
A free Bootstrap admin template maintained by CoreUI, built on CoreUI's own UI component library. It provides compiled HTML pages and Pug template source code, covering dashboards, authentication, forms, components, icons, and error pages.
HTML · Admin dashboard
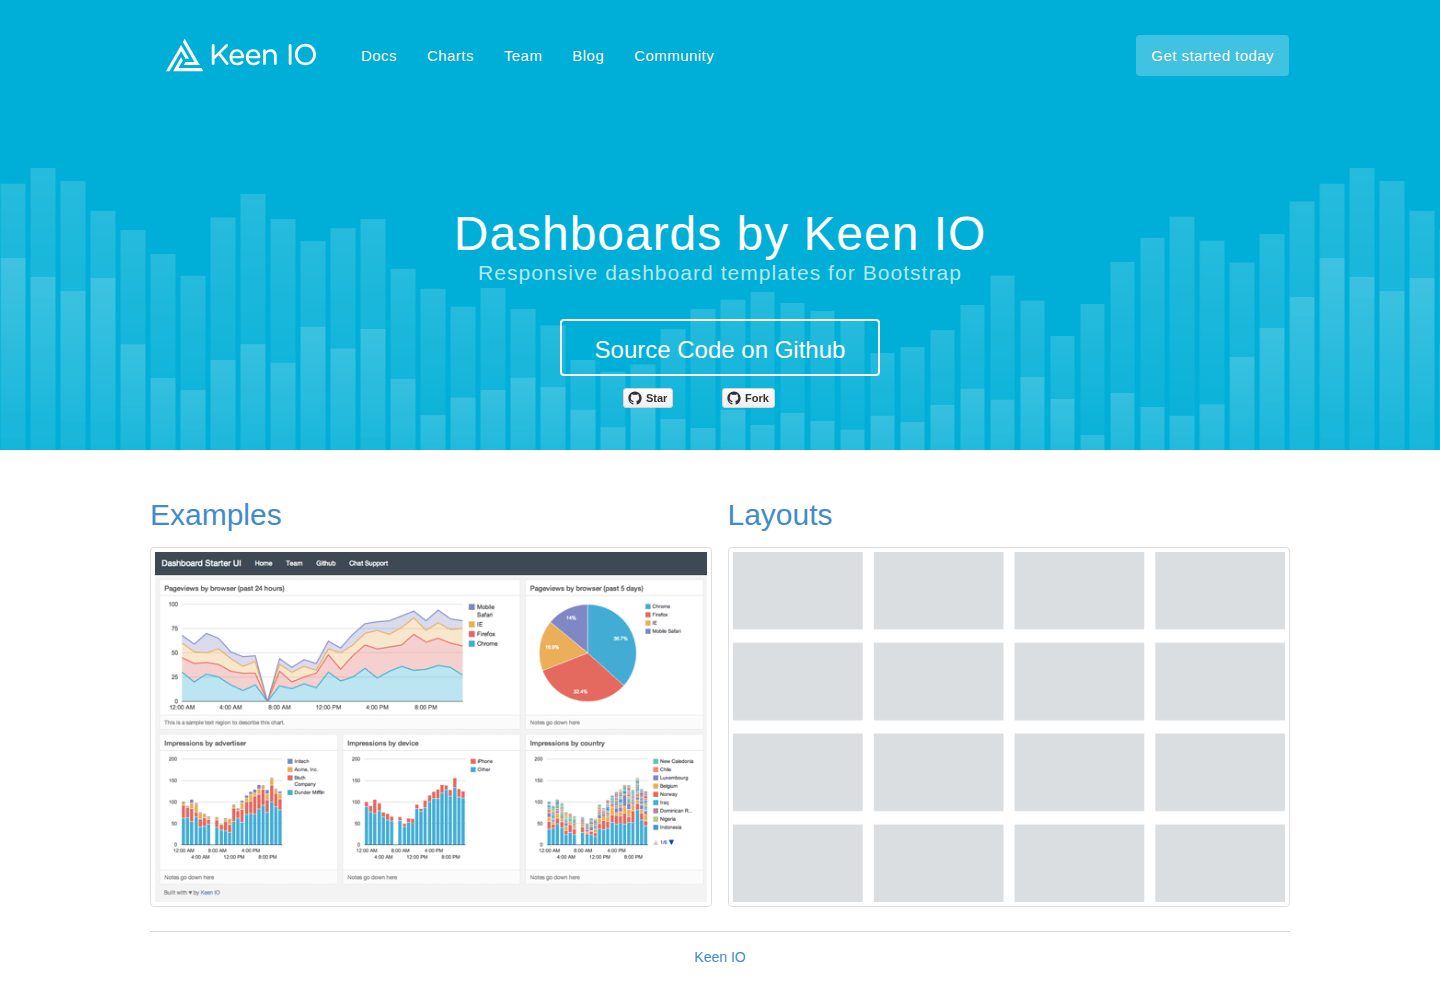
dashboards
A collection of responsive dashboard HTML templates open-sourced by Keen IO, built on CSS Grid, offering multiple prebuilt admin data interface layouts.
HTML · Admin dashboard
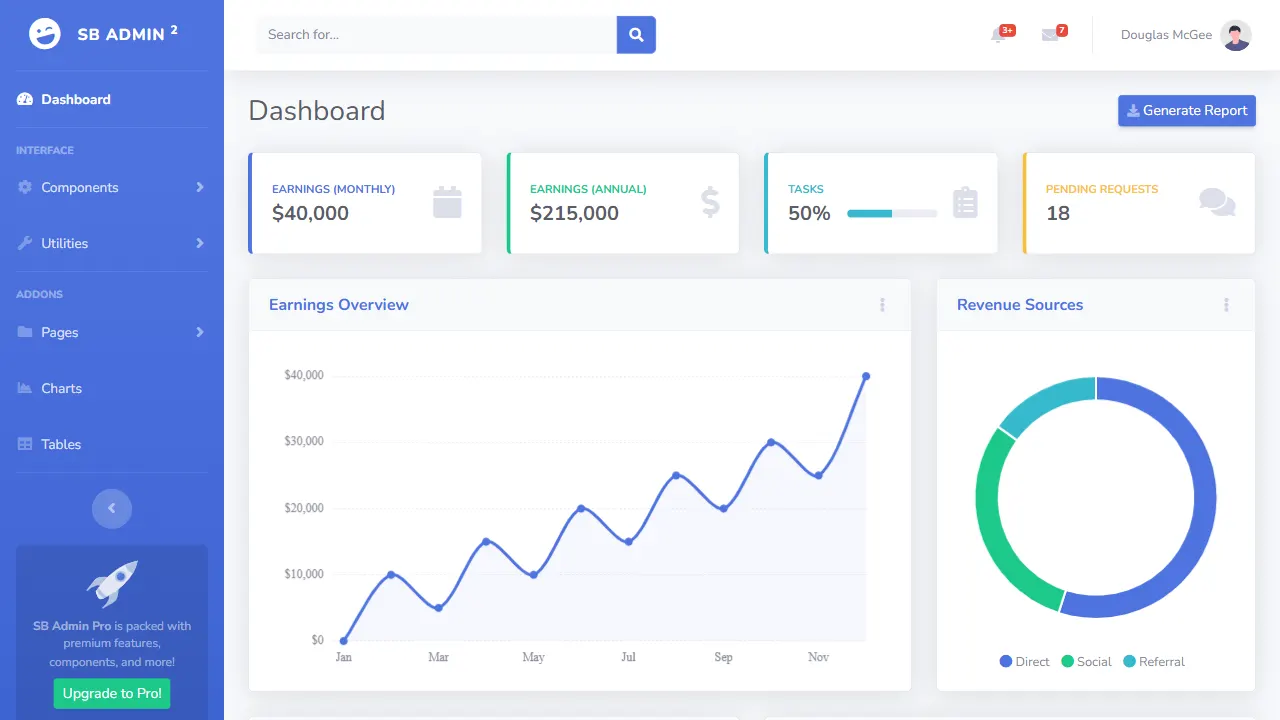
SB Admin 2
SB Admin 2 is a classic Bootstrap admin template from Start Bootstrap, offering dashboards, charts, tables, and common management pages.
HTML · Admin dashboard
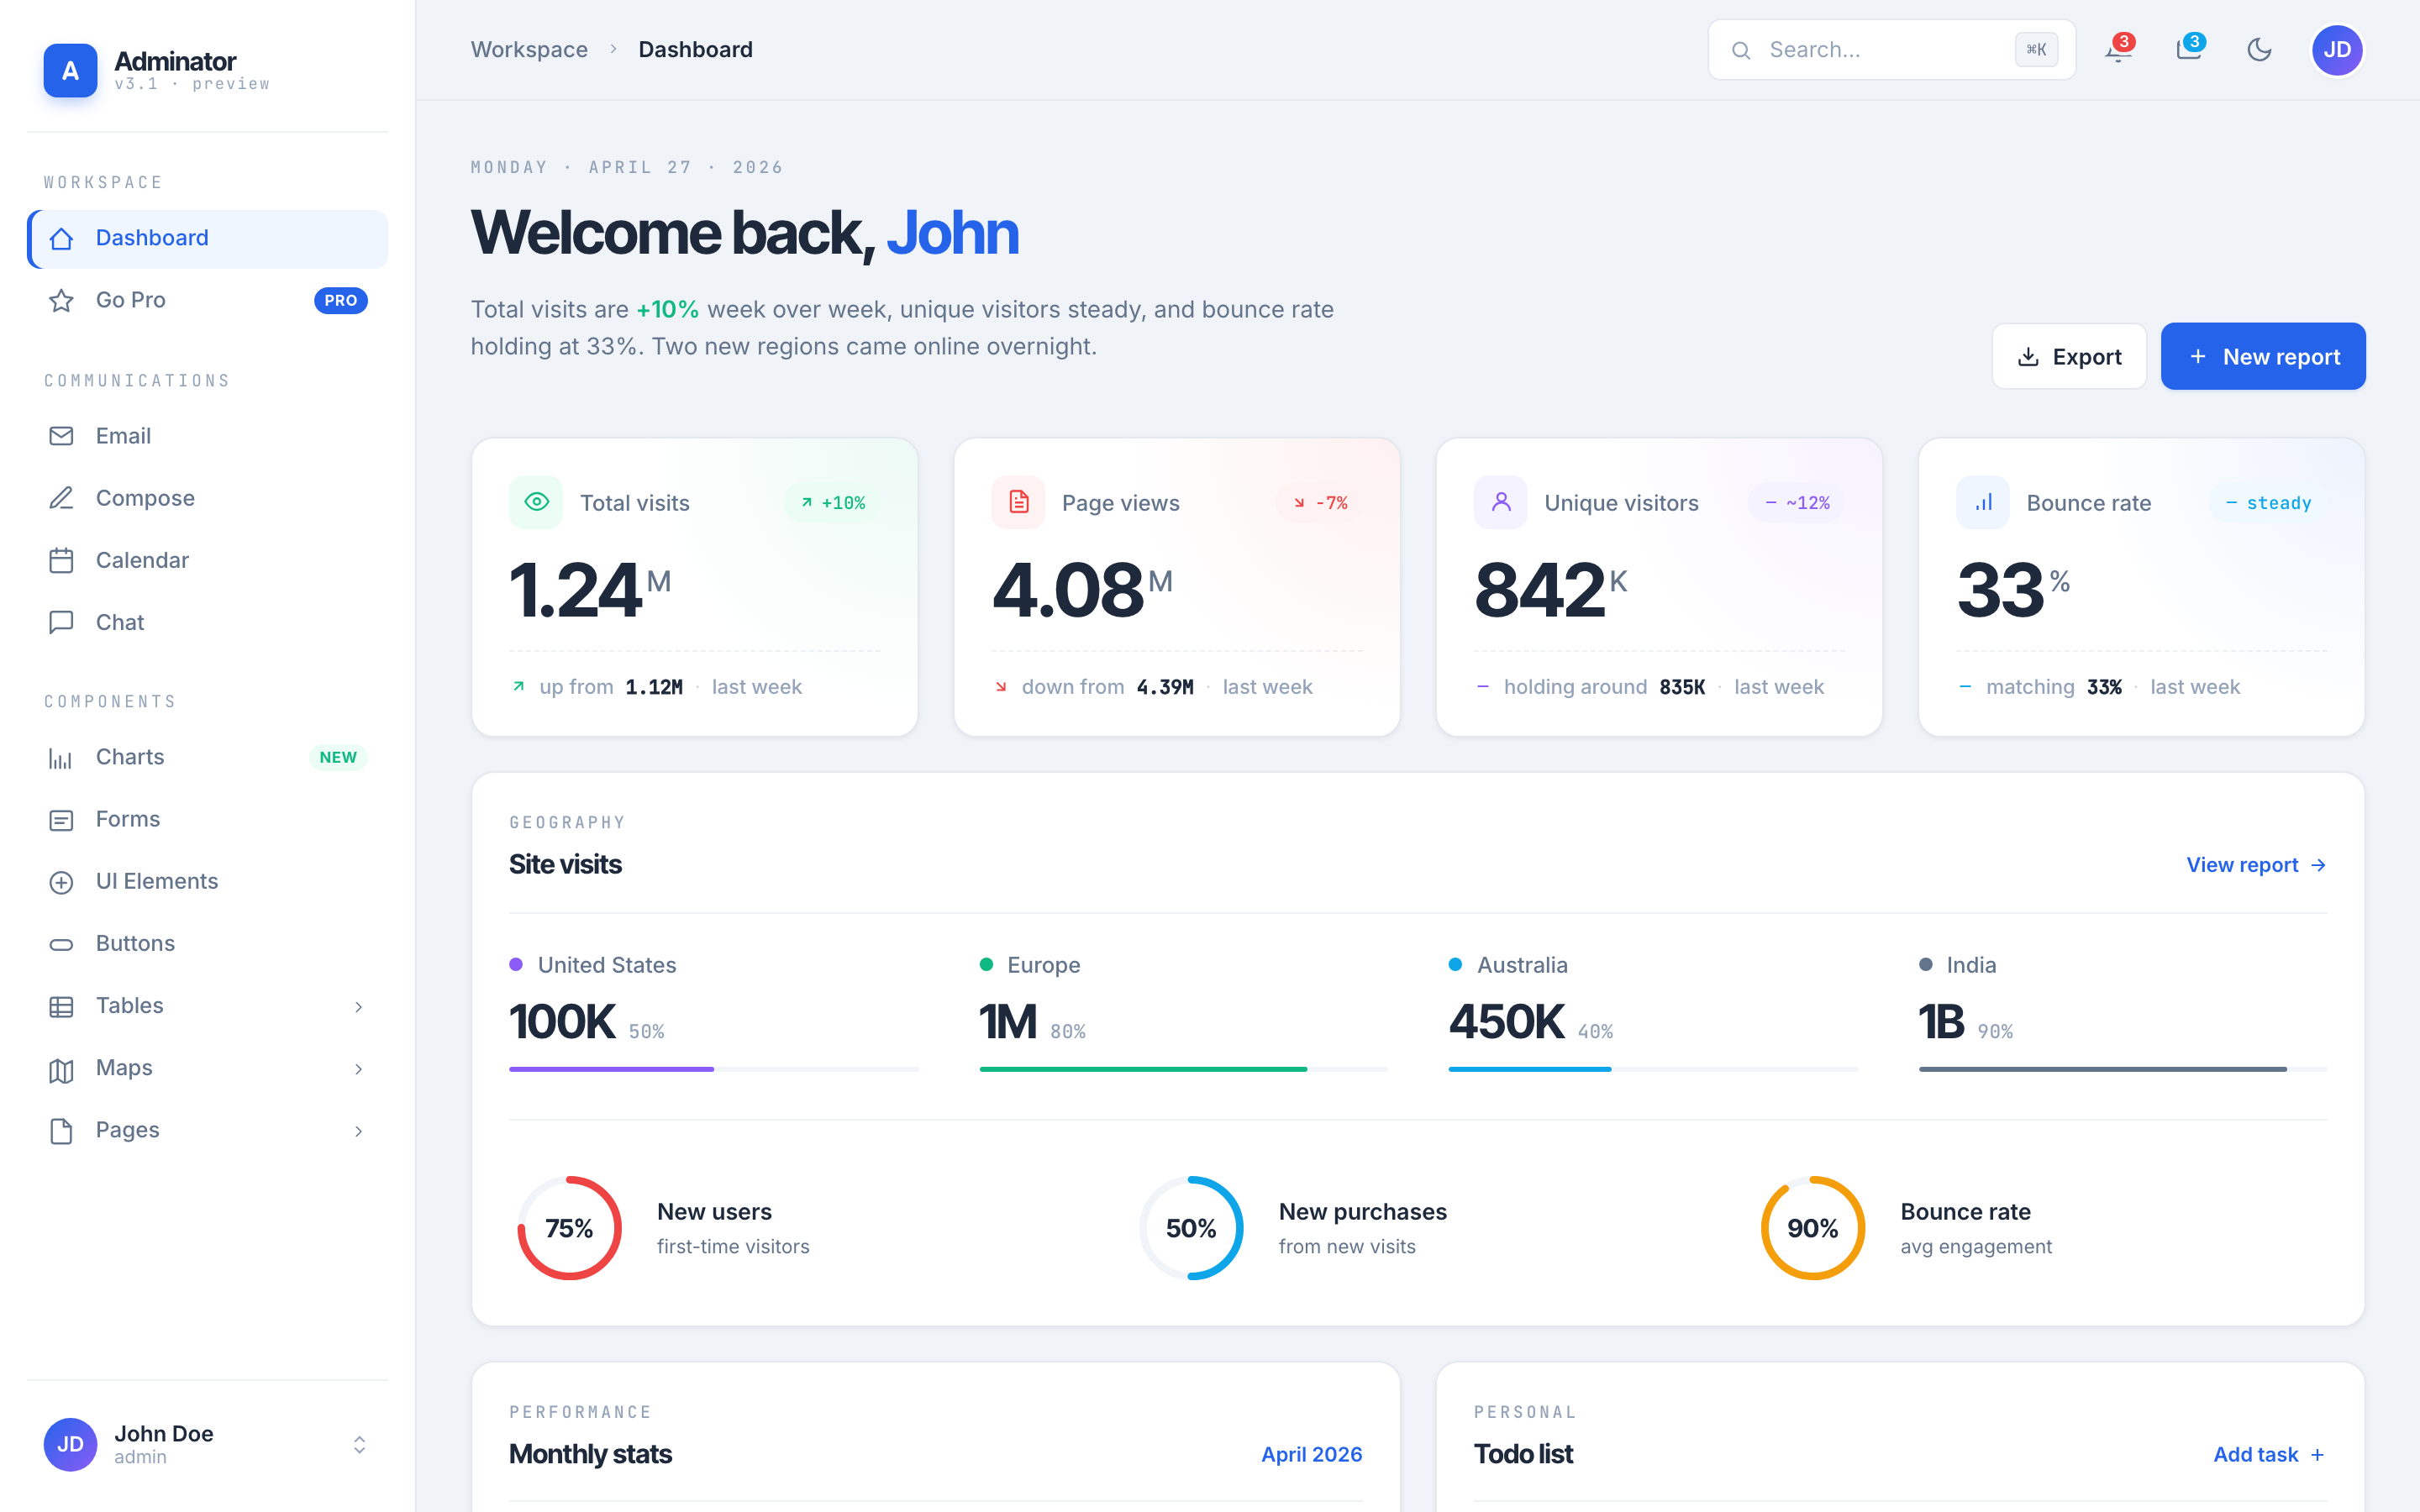
Adminator-admin-dashboard
Adminator 4 is a vanilla HTML, CSS and JavaScript admin dashboard template with a CSS-variable token design system, built-in light and dark themes, no jQuery or Bootstrap dependency, and 18 pages covering dashboards, mail, calendar, charts, forms, tables and error pages.
HTML · Admin dashboard