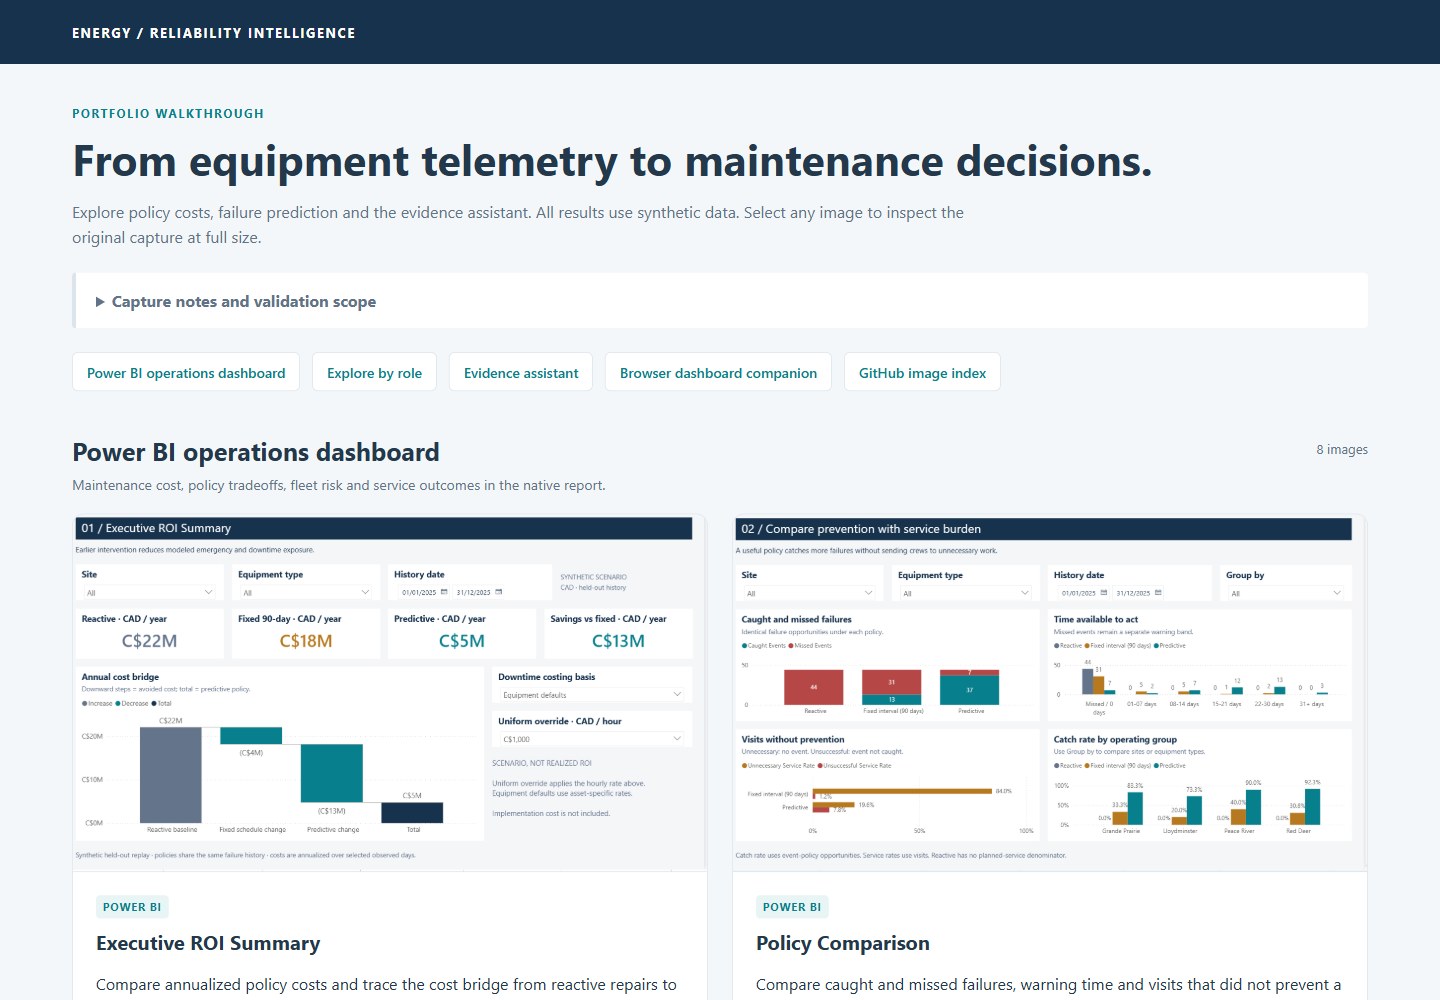
使用 80 台设备、18 个月、43,760 条每日快照和 236 次故障事件的合成 SCADA 风格遥测数据。
HTML后台
oil-gas-equipment-predictive-maintenance — HTML 后台模板
作者 namarshi-data
一个基于合成 SCADA 遥测数据的预测性维护决策工作流,用 Python/SQL 对比反应式、固定 90 天与预测性维修策略的成本与停机时间,并附带 Power BI 仪表板和本地证据助手。
看看你的网站会是什么样
浏览真实页面截图,比较内容排版与手机效果。点击下方缩略图切换,放大查看整页细节。
全部页面与视图 2
截图用于了解视觉与布局,交互效果请以实际项目为准。
采集于 2026-10-16查看来源
值得关注的模板亮点
从已有项目资料中,快速了解它的特点。
SQL 清洗去除 251 条重复读数并标记 9,298 个插补传感器单元格,特征包含 7/30 天均值、变化率和缺失指示。
逻辑回归与梯度提升模型在 4,880 个留出资产日上评估,梯度提升平均精度 0.931、精确率 99.1%、召回率 66.2%。
在 91 天回放中对比反应式、固定 90 天和预测性三种策略的预防/漏检故障数、计划访问、停机小时和期间成本。
提供可编辑的 Power BI 项目(TMDL/PBIR 源、原子事实星型模式、75 个度量、六个页面)和本地证据助手。
README 记录了独立机队、新设备、缺失维护、传感器故障和较弱干预下的性能下降与业务案例反转条件。
模板详细介绍
该项目围绕一个业务问题展开:在计入不必要巡检、漏检故障和停机成本后,基于状态的维护是否优于按日历维护。README 说明其使用 80 台泵机、压缩机和管道泵的合成 Alberta 场景数据,覆盖 18 个月、43,760 条每日快照和 236 次故障事件,事件频率被有意调高以便测试。
工作流包含:合成数据生成、SQL 清洗与特征工程(7/30 天均值、变化率、缺失指示和历史维护关联)、Python 探索分析、30 天故障预测模型(逻辑回归与直方图梯度提升,共享 38 个特征白名单,按日历切分并做 30 天标签清除)、策略回放与成本核算,以及 Power BI 仪表板和本地证据助手。README 明确这些是模拟结果而非现场验证的节省,未来传感器在预防后不会重新生成,因此属于透明的决策核算而非因果估计。
限制方面,README 指出所选评分器未校准,输出的是风险分数而非故障概率或剩余使用寿命;Azure 部署定义已提供但未实际部署,云执行未验证;助手默认使用基于规则的规划器,演示身份不是生产认证;Power BI 的 Desktop 刷新、DAX 交互、移动端行为和 Service RLS 仍需独立验收。
HTML后台
适合你的项目吗?
适用场景
- 评估基于状态的维护策略与固定日历维护在模拟成本与停机上的差异。
- 研究从每日遥测数据构建 30 天故障分类模型的特征工程与时间序列评估流程。
- 查看 Power BI 仪表板如何组织 ROI、策略、机队风险、模型性能和服务审计页面。
- 测试站点范围的证据助手在确定性计算、引用和注入尝试下的本地评估表现。
- 复现合成数据生成、SQL 清洗、模型评估和策略回放的完整本地流程。
适合人群
- 希望了解预测性维护决策核算与策略对比方法的数据科学和机器学习从业者。
- 需要参考 SQL 清洗、特征工程和时间序列模型评估实现细节的工程师。
- 对 Power BI 原子事实星型模式和 DAX 度量组织方式感兴趣的商业智能开发者。
- 研究合成遥测数据下模型泛化限制与业务案例敏感性的分析人员。
上手与定制指南
结合仓库当前版本的说明,按下面的资料检查内容、配置与运行要求。
- 1
README 要求 Python 3.11+,在项目根目录创建虚拟环境并安装 requirements.txt 和可编辑的 dev 依赖。
- 2
运行 scripts/launch_local.py check 进行本地检查,或使用 START_LOCAL.cmd 启动;macOS/Linux 需将 .venv/Scripts/python 替换为 .venv/bin/python。
- 3
无需安装即可浏览 screenshots 目录,或解压后打开 reports/portfolio.html 与 reports/dashboard.html;GitHub 仅显示 HTML 源码,浏览器版本不执行 DAX 或 RLS。
- 4
Azure 部署定义已提供但未部署,环境构建、权限、端点执行和 GitHub 托管 CI 仍属外部验收步骤。
- 5
README 未提供依赖清单中具体框架版本号,也未说明生产环境部署步骤。
授权与来源资料
使用条件与限制
免费使用 · 保留许可声明本次收录的是公开仓库中采用 MIT 许可的免费版本;免费范围为该版本代码,不代表外部服务或第三方素材免费。
使用时需要遵守
- 允许免费使用、修改、商用和分发该版本代码。
- 分发代码副本或实质性部分时,保留原作者版权声明和完整 MIT 许可声明。
- 代码按现状提供;担保与责任限制以原许可证及适用法律为准。
额外费用与待核对事项
- 演示图片、字体、图标及其他第三方素材需按各自许可核对,不能仅凭代码的 MIT 许可判断。
- 域名、托管、数据库、支付或 AI 等外部服务可能另外收费。
- README 明确这些是模拟结果,不是现场验证的节省;年度成本是对同一机队刻意故障密集回放的推算。
- Azure 部署定义虽已提供,但云执行尚未验证;本地路径才是实际可运行的。
- 使用简化的 AER 风格字段,未使用任何运营商或监管机构遥测数据,事件频率被有意调高以便测试。
- 特征为日终特征,并非实时特征存储。
- 所选评分器未校准,输出的是二分类风险分数,而非故障概率或剩余使用寿命;不能据此推断可迁移到真实设备。
- 表中为期间总计而非年度应急维修成本;预测性维护可预防 37/41 渐进故障,但对 3 次突发跳闸为 0。
- 容量研究使用贪心启发式排程,并非路线或人力优化;C$192,000/年项目预算与 C$75,000 实施费为情景输入,非实际发生成本或报价。
- 预防后不会重新生成未来传感器数据,因此这是透明的决策核算,而非现场节省的因果估计。
- 在三个声明种子上,独立机队的召回率从 66.2% 降至 49.8%-55.5%,单一合成机队会高估迁移性能。
- 新设备在 150 个正样本资产日上召回率为 0%;批量调试标记仅请求复核,并不能提升召回。
- 卡零读数使受影响队列召回率从 72.41% 降至 18.97%;范围内故障可通过边界检查,未建立传感器诊断能力。
- 在 14 天可行动窗口和 70% 成功率下,相对固定维护每年约损失 C$884,454,建模业务案例可能反转。
- 未部署任何 Azure 资源;环境构建、权限、端点执行和 GitHub 托管 CI 仍属外部验收步骤。
- Power BI 的 Desktop 刷新、DAX 交互、移动端行为、实际查看者 Service RLS 和 Key Influencers 仍需独立验收。
- 助手默认使用基于规则的规划器,演示身份不是生产认证;可选函数调用仅有模拟测试,无实时模型评估,且未集成 Copilot。
查看原文依据
Permission is hereby granted, free of charge
许可证原文
**Simulation results, not field-validated savings.** Annual costs extrapolate a deliberately failure-rich replay of the same fleet. Gross avoided repairs are already included in operating savings; incremental program costs are considered separately.
README 原文
The solid path runs locally. The Azure deployment definitions are supplied; cloud execution remains unvalidated.
README 原文
[Source mapping](docs/sources.md) and the [data dictionary](docs/data_dictionary.md) document simplified AER-inspired fields. No operator or regulator telemetry is used; event frequency is intentionally enriched for testing.
README 原文
[Causal cleaning](sql/01_clean.sql) deduplicates records, validates ranges and imputes from earlier valid observations. [Features](sql/02_features.sql) include 7/30-day means, change rates, missingness indicators and historical maintenance joins. These are end-of-day features, not a real-time feature store.
README 原文
The selected scorer is **uncalibrated**. It produces risk scores for binary classification, not established failure probabilities or remaining useful life. Separate calibration experiments and conditional asset-bootstrap intervals are reported in [generalization](docs/generalization.md); they do not establish transfer to real equipment.
README 原文
**These are period totals, not annual emergency-repair costs.** They include planned service, emergency repairs and planned/unplanned downtime. [Event outcomes](data/processed/dashboard/event_outcomes.csv) and [service visits](data/processed/dashboard/service_visits.csv) expose misses and unproductive interventions. Predictive service prevents 37/41 gradual failures and 0/3 abrupt trips, which the generator defines as unpreventable.
README 原文
The [capacity study](docs/operations.md) applies equal weekly limits: at three planned visits/week, predictive prevention falls to 30/44 versus 7/44 for fixed servicing. Booking uses a greedy heuristic, not route or workforce optimization. An illustrative C$192,000/year program budget plus C$75,000 implementation gives C$13.23M recurring and C$13.15M first-year savings. These are scenario inputs, not incurred costs or quotes.
README 原文
Future sensors are not regenerated after prevention. This is transparent decision accounting, not a causal estimate of field savings. [Methodology](docs/methodology.md)
README 原文
| [Independent fleets](docs/generalization.md) | Recall falls from 66.2% to 49.8%-55.5% across three declared seeds. | One synthetic fleet overstates transfer performance. |
README 原文
| [New equipment](docs/robustness.md) | Six fixtures: 0% recall across 150 positive asset-days. | Batch commissioning flags request review; they do not improve recall. |
README 原文
| [Sensor faults](docs/sensor-fault-tests.md) | Stuck-zero readings lower affected-cohort recall from 72.41% to 18.97%. | In-range faults pass bounds checks; no sensor diagnosis is established. |
README 原文
| [Weaker interventions](reports/sensitivity.csv) | At 14 actionable days and 70% success: approximately C$884,454/year loss versus fixed. | The modeled business case can reverse. |
README 原文
No Azure resources are deployed. Environment builds, permissions, endpoint execution and GitHub-hosted CI remain external acceptance steps. [Engineering evidence](docs/mlops.md)
README 原文
Local validation covers Microsoft parsing, schemas, bindings and independent ledger arithmetic. Native screenshots show visible output; Desktop refresh, DAX interactions, mobile behavior, actual-viewer Service RLS and Key Influencers still require independent acceptance.
README 原文
https://github.com/namarshi-data/oil-gas-equipment-predictive-maintenance/blob/main/LICENSEhttps://github.com/namarshi-data/oil-gas-equipment-predictive-maintenance/blob/main/README.mdThe [assistant](docs/ai-assistant.md) queries authorized records with deterministic calculations and citations. **41/41 local evaluation cases** cover grounding, unsupported questions, cross-site access and injection attempts. Its default planner is rules-based; the demonstration identity is not production authentication. Optional function calling has mock tests but no live-model evaluation. Copilot is not integrated.
README 原文
DeepSeek 根据仓库许可证和 README 整理 ·2026-10-15。结果仅覆盖已读取资料,依赖、图片、字体及后续条款变更以各自原文为准。
项目核对记录与介绍依据
模板资料
- 来源平台
- GitHub
- 资料与维护参考分
- 资料一般 · 68 / 100
- 技术栈
- HTML
- 网站类型
- 后台
这个分数如何计算
本站按许可资料(最高30分)、演示链接(12分)、预览图(10分)、Star数(15分)、记录的维护时间(15分)、描述完整度(8分)、功能记录(5分)和分类资料(5分)计算。它不是代码、安全或性能测试,也不是 Google 评分;有链接不代表已实测可用。
这个项目需要核对什么
- 记录的仓库更新时间
- 2026-09-21
- 截图检查日期
- 2026-10-16
目前没有记录演示链接。请依据仓库说明在本地评估;仅凭截图无法确认交互行为。
目录记录的主要技术栈是 HTML。请通过依赖清单和锁文件核对实际版本与托管要求。这些说明基于收录资料,不代表代码审计或部署实测。
查看具体选型方法 →介绍的制作与核对状态
介绍由 AI 辅助整理目录与仓库资料。仓库作者不等于这篇介绍的审核者。
审核声明: codex-user-requested-batch-review-20261017 · 2026-10-16
查看当时使用的来源资料
SHA-256: 1a37bfc320c8d0360003e7cf246bc9d9fa742b83fefe4c5a2fa8859bf6439333
2026-10-15T13:34:53.533Z
来源文件 / 仓库<!-- PORTFOLIO_HEADLINE:START -->
# Predictive Maintenance for Oil & Gas Operations
A reproducible maintenance decision workflow that classifies **next-30-day equipment failure** from **daily synthetic SCADA-style telemetry**, then compares predictive service with reactive repairs and fixed 90-day servicing.
*Synthetic Alberta-inspired scenario · 80 assets · 18 months of history · 91-day held-out replay · CAD estimates*
**Simulation results, not field-validated savings.** Annual costs extrapolate a deliberately failure-rich replay of the same fleet. Gross avoided repairs are already included in operating savings; incremental program costs are considered separately.
- **C$13.42M/year modeled operating savings vs. current fixed-interval maintenance.**
- **82.0% less unplanned downtime vs. current fixed-interval maintenance** (90-day servicing).
- **19-day median warning vs. current reactive maintenance's 0 days**, among 37 of 44 failures caught in simulation.
- **C$4.93M/year modeled emergency-repair avoidance vs. current reactive maintenance** (an included cost component).
    
<img src="reports/figures/failure_warning_summary.png" width="860" alt="Failure warning distribution for reactive, fixed 90-day and predictive maintenance on the same synthetic history; missed events are retained in the first band.">
<!-- PORTFOLIO_HEADLINE:END -->
**The business decision:** does condition-driven maintenance outperform the service calendar once unnecessary visits, missed failures and downtime are costed?
[Visual evidence](#visual-evidence) · [Policy comparison](#5-maintenance-policy-and-business-case) · [Failure findings](#failure-modes-and-measured-limits) · [Quick start](#quick-start) · [Full technical walkthrough](docs/technical-walkthrough.md)
## Review by role
| Role | Evidence to inspect |
|---|---|
| **Data Scientist** | [Model card](docs/model-card.md): causal features, temporal evaluation and validation-only threshold selection. [Generalization](docs/generalization.md): independent fleets, calibration and uncertainty. |
| **ML Engineer** | [Operating design](docs/mlops.md): provenance, batch-contract validation, quality advisories, mature-label monitoring and deployment gates. |
| **AI Engineer** | [Evidence assistant](docs/ai-assistant.md): site-scoped queries, deterministic calculations, citations and authorization/injection evaluations. |
| **Power BI / Analytics** | [Dashboard guide](docs/powerbi.md): atomic facts, filter-aware DAX, dynamic site RLS and reporting acceptance checks. |
### Visual evidence
| Power BI: Executive ROI | Assistant: policy comparison |
|---|---|
| [](screenshots/powerbi-native/01-executive-roi.png) | [](screenshots/assistant/01-policy-comparison-after.jpg) |
The [gallery](screenshots/README.md) distinguishes native Power BI output from browser demonstrations and records capture limitations.
## System architecture
```mermaid
flowchart LR
A[Daily synthetic telemetry and maintenance] --> B[Causal SQL cleaning and features]
B --> C[Temporal model evaluation and daily risk scores]
C --> D[Policy replay and cost accounting]
D --> E[Event and service ledgers]
E --> F[Power BI and HTML dashboard]
E --> G[Site-scoped evidence assistant]
C --> G
C -. Proposed cloud execution .-> H[Azure ML registry and batch endpoint]
```
The solid path runs locally. The Azure deployment definitions are supplied; cloud execution remains unvalidated.
## 1. Business problem and synthetic equipment data
[Synthetic generation](src/energy_failure/synthetic.py) produces 80 pumpjacks, compressors and pipeline pumps at fictional Alberta sites: 18 months, 43,760 daily snapshots and 236 failure events. Degradation, seasonality, noise, communication outages and invalid readings exercise the workflow.
[Source mapping](docs/sources.md) and the [data dictionary](docs/data_dictionary.md) document simplified AER-inspired fields. No operator or regulator telemetry is used; event frequency is intentionally enriched for testing.
## 2. SQL cleaning and feature engineering
[Causal cleaning](sql/01_clean.sql) deduplicates records, validates ranges and imputes from earlier valid observations. [Features](sql/02_features.sql) include 7/30-day means, change rates, missingness indicators and historical maintenance joins. These are end-of-day features, not a real-time feature store.
The reference run removes 251 duplicate readings and flags 9,298 imputed sensor cells. [Quality counts](data/processed/cleaning_quality.json) reconcile raw and cleaned output.
## 3. Python exploratory analysis
The [EDA notebook](notebooks/01_explore.ipynb) examines training-period degradation and sensor relationships. Held-out business plots are labelled separately. Rising vibration and temperature reflect the generator's programmed patterns, so they are not a field discovery. The [technical walkthrough](docs/technical-walkthrough.md) retains figures, experiment design and debugging examples.
## 4. Thirty-day failure prediction
Logistic regression and histogram gradient boosting share a 38-feature allowlist excluding identifiers, future outcomes, costs and oracle state. Calendar splits use 30-day label purges. Model and threshold selection minimize **validation policy cost among the tested candidates**.
<!-- PORTFOLIO_MODELS:START -->
| Model | Selected threshold | Average precision | Precision | Recall | Brier score |
|---|---:|---:|---:|---:|---:|
| Logistic regression | 0.85 | 0.909 | 96.3% | 58.7% | 0.043 |
| **Gradient boosting** | 0.90 | 0.931 | 99.1% | 66.2% | 0.036 |
<!-- PORTFOLIO_MODELS:END -->
Both models are evaluated on 4,880 held-out asset-days in April-May 2025. June's incomplete labels are excluded from classification metrics; policy evaluation counts observed events through June. Daily recall differs from event prevention because multiple positive days can precede one failure.
The selected scorer is **uncalibrated**. It produces risk scores for binary classification, not established failure probabilities or remaining useful life. Separate calibration experiments and conditional asset-bootstrap intervals are reported in [generalization](docs/generalization.md); they do not establish transfer to real equipment.
## 5. Maintenance policy and business case
All policies share the same 91-day history. Fixed servicing follows installation dates plus 90-day intervals, including eligible pre-period visits. Predictive servicing dispatches two days after an alert and applies a 30-day cooldown. Both intervention policies use a 30-day actionable window and 90% success assumption.
<!-- PORTFOLIO_POLICIES:START -->
| Policy | Prevented / missed failures | Planned visits in period | Unplanned hours | Total downtime hours | Total period cost, CAD |
|---|---:|---:|---:|---:|---:|
| Reactive | 0 / 44 | 0 | 3,877.0 | 3,877.0 | C$5,505,868 |
| Fixed 90-day | 13 / 31 | 81 | 2,607.1 | 3,093.1 | C$4,527,234 |
| Predictive | 37 / 7 | 51 | 469.0 | 771.0 | C$1,183,653 |
<!-- PORTFOLIO_POLICIES:END -->
**These are period totals, not annual emergency-repair costs.** They include planned service, emergency repairs and planned/unplanned downtime. [Event outcomes](data/processed/dashboard/event_outcomes.csv) and [service visits](data/processed/dashboard/service_visits.csv) expose misses and unproductive interventions. Predictive service prevents 37/41 gradual failures and 0/3 abrupt trips, which the generator defines as unpreventable.
The [capacity study](docs/operations.md) applies equal weekly limits: at three planned visits/week, predictive prevention falls to 30/44 versus 7/44 for fixed servicing. Booking uses a greedy heuristic, not route or workforce optimization. An illustrative C$192,000/year program budget plus C$75,000 implementation gives C$13.23M recurring and C$13.15M first-year savings. These are scenario inputs, not incurred costs or quotes.
Future sensors are not regenerated after prevention. This is transparent decision accounting, not a causal estimate of field savings. [Methodology](docs/methodology.md)
### Failure modes and measured limits
| Challenge | Measured finding | Interpretation |
|---|---|---|
| [Independent fleets](docs/generalization.md) | Recall falls from 66.2% to 49.8%-55.5% across three declared seeds. | One synthetic fleet overstates transfer performance. |
| [New equipment](docs/robustness.md) | Six fixtures: 0% recall across 150 positive asset-days. | Batch commissioning flags request review; they do not improve recall. |
| [Missing maintenance](docs/robustness.md) | Removing alternating repairs raises false positives from 5 to 14. | Missing history changes decisions. |
| [Sensor faults](docs/sensor-fault-tests.md) | Stuck-zero readings lower affected-cohort recall from 72.41% to 18.97%. | In-range faults pass bounds checks; no sensor diagnosis is established. |
| [Weaker interventions](reports/sensitivity.csv) | At 14 actionable days and 70% success: approximately C$884,454/year loss versus fixed. | The modeled business case can reverse. |
## 6. Azure ML pipeline and batch scoring
[Deployment definitions](deployment/) cover infrastructure, training/evaluation, registration, batch scoring and candidate validation before promotion. Local batch checks reconcile **7,280 predictions**, including complete unique row coverage, identities, scores and metadata. [Provenance](artifacts/provenance.json) and mature-label monitoring support auditability.
No Azure resources are deployed. Environment builds, permissions, endpoint execution and GitHub-hosted CI remain external acceptance steps. [Engineering evidence](docs/mlops.md)
## 7. Power BI dashboard and evidence assistant
The editable [Power BI project](powerbi/EnergyPredictiveMaintenance.pbip) uses TMDL/PBIR source, an atomic-fact star schema and 75 documented measures. Six visible pages cover ROI, policies, fleet risk, model performance, service audit and methodology.
Local validation covers Microsoft parsing, schemas, bindings and independent ledger arithmetic. Native screenshots show visible output; Desktop refresh, DAX interactions, mobile behavior, actual-viewer Service RLS and Key Influencers still require independent acceptance.
The [assistant](docs/ai-assistant.md) queries authorized records with deterministic calculations and citations. **41/41 local evaluation cases** cover grounding, unsupported questions, cross-site access and injection attempts. Its default planner is rules-based; the demonstration identity is not production authentication. Optional function calling has mock tests but no live-model evaluation. Copilot is not integrated.
## Quick start
**No installation:** browse the [screenshots](screenshots/README.md). After extracting, open [reports/portfolio.html](reports/portfolio.html) or [reports/dashboard.html](reports/dashboard.html). GitHub displays HTML source; the browser companion does not execute DAX or RLS.
For Python 3.11+, run from the extracted project root on Windows:
```powershell
python -m venv .venv
.venv/Scripts/python -m pip install -r requirements.txt
.venv/Scripts/python -m pip install -e ".[dev]"
.venv/Scripts/python scripts/launch_local.py check
```
Then use [START_LOCAL.cmd](START_LOCAL.cmd), or launch the assistant with `.venv/Scripts/python scripts/launch_local.py assistant`. On macOS/Linux, replace `.venv/Scripts/python` with `.venv/bin/python`.
To reproduce the reference analysis, run `.venv/Scripts/python -m energy_failure.pipeline --output-root .`, then `.venv/Scripts/python scripts/build_readme.py`. Regeneration replaces generated outputs. [START_HERE.md](START_HERE.md) covers the full studies and checks; [LOCAL_SETUP.md](LOCAL_SETUP.md) covers notebooks and Power BI path configuration. Reference artifacts and demo facts are included; raw/training data are [generated locally](data/README.md).
[Validation record](reports/validation.md) · [Full technical walkthrough](docs/technical-walkthrough.md) · [MIT license](LICENSE)
## About the author
I'm **Namarshi Palit**, seeking **Data Scientist, ML Engineer or AI Engineer** opportunities in **Alberta**. I focus on turning operational data into rigorously evaluated models, traceable decisions and practical tools, and aim to join a team solving real operational problems through data and AI.
[LinkedIn](https://www.linkedin.com/in/namarshi-palit-1a9534186) · [GitHub](https://github.com/namarshi-data) · [Email](mailto:[email protected])
看看同类模板
对比同技术栈与用途的模板,找到更适合的视觉与内容结构。
AdminLTE
基于 HTML、Bootstrap 5 和原生 JavaScript 的管理后台模板。Astro 用于构建文档;React、Vue 与 Angular 版本分别位于其他仓库。
HTML · 后台
gentelella
Free admin dashboard template — vanilla JS, SCSS, Vite 8. No Bootstrap, no jQuery.
HTML · 后台
coreui-free-bootstrap-admin-template
Free Bootstrap Admin & Dashboard Template Built for AI-Assisted Development
HTML · 后台
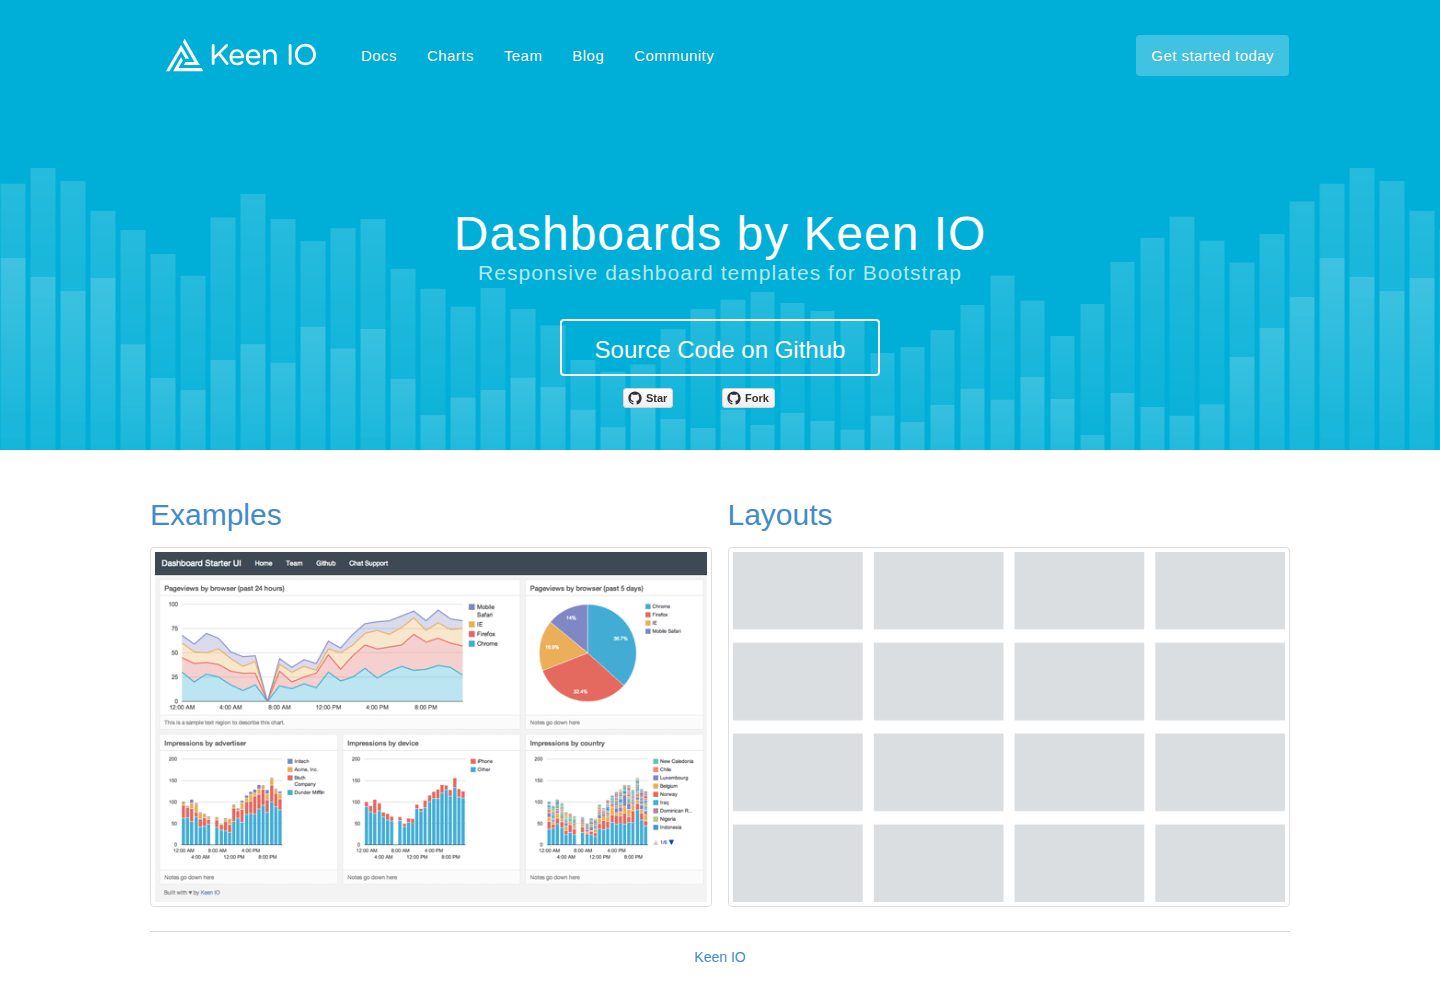
dashboards
Responsive dashboard templates 📊✨
HTML · 后台
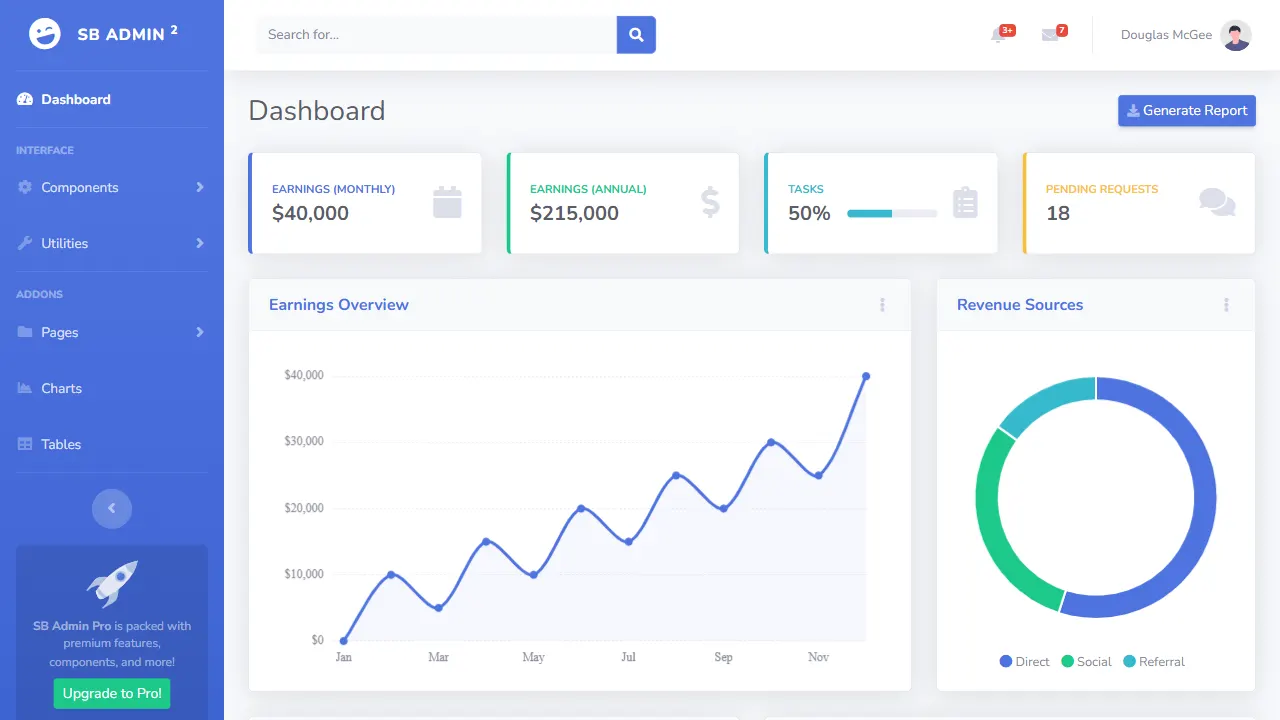
SB Admin 2
SB Admin 2 是 Start Bootstrap 推出的开源后台模板,基于 Bootstrap 构建,整体风格偏向经典管理界面。
HTML · 后台
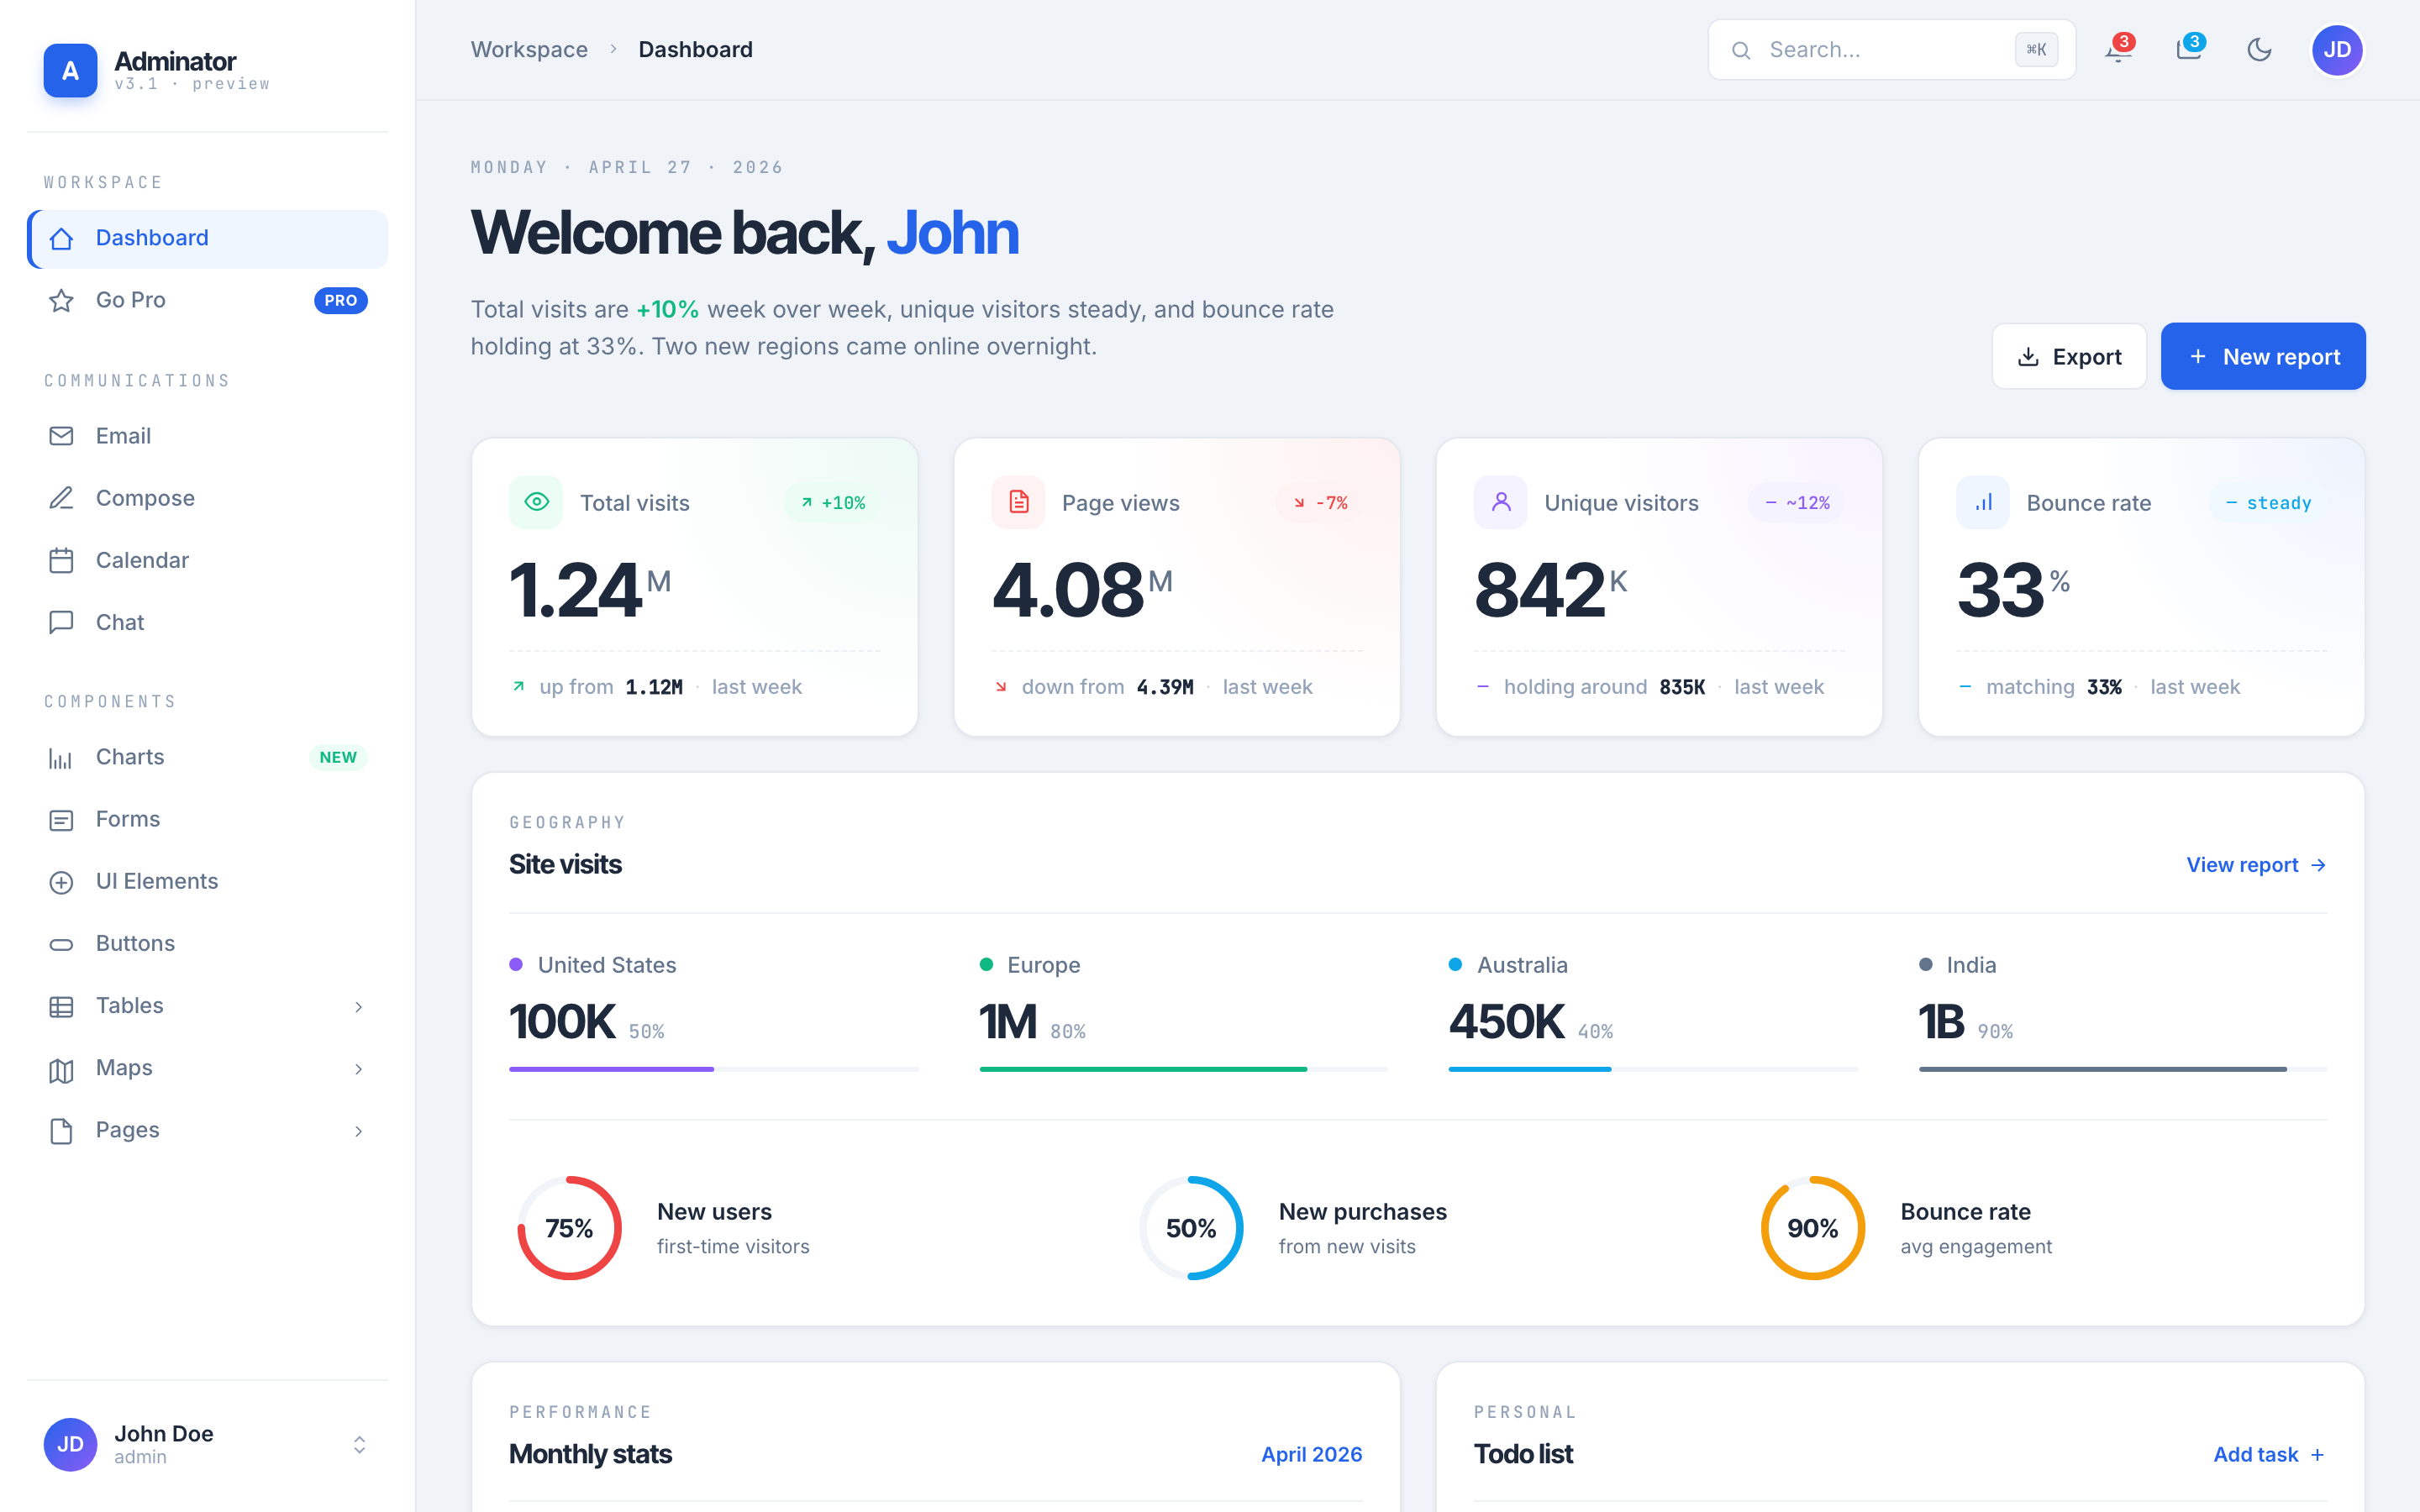
Adminator-admin-dashboard
Adminator is easy to use and well design admin dashboard template with dark mode for web apps, websites, servi…
HTML · 后台