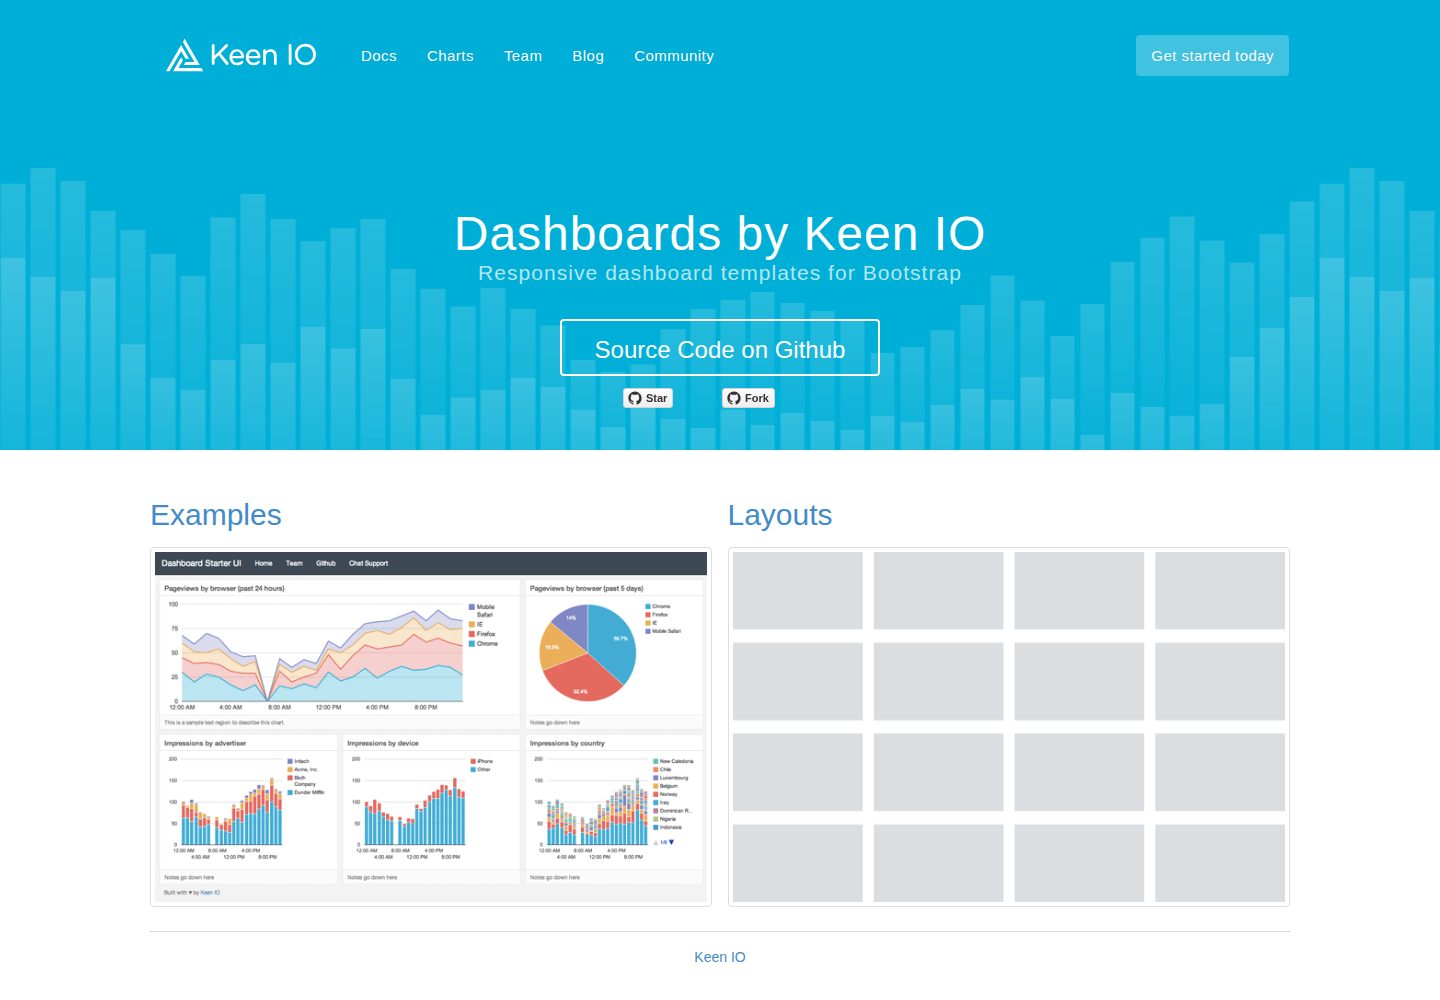
基于 CSS Grid 的响应式仪表盘布局,包含 Layouts 与 Examples 两类模板
HTML后台
dashboards — HTML 后台模板
作者 keen
Keen IO 开源的响应式仪表盘 HTML 模板集合,基于 CSS Grid 布局,提供多种预置后台数据界面版式。
看看你的网站会是什么样
浏览真实页面截图,比较内容排版与手机效果。点击下方缩略图切换,放大查看整页细节。
全部页面与视图 2
截图用于了解视觉与布局,交互效果请以实际项目为准。
采集于 2026-10-02查看来源
值得关注的模板亮点
从已有项目资料中,快速了解它的特点。
图表区域使用 .chart-wrapper、.chart-title、.chart-stage、.chart-notes 结构组织
不绑定数据源与图表库,示例已接入 keen-dataviz.js 与 keen-analysis.js
提供 demo-data 示例数据,可在没有 Keen IO 账号时先接入演示
附 Dockerfile,可构建镜像并以容器方式运行
采用 MIT 许可,允许免费使用、修改、商用和分发
模板详细介绍
这是一套用 HTML 与 CSS 编写的响应式仪表盘模板,仓库由 Keen IO 维护。模板以 CSS Grid 组织页面布局,覆盖常见的后台数据看板版式,仓库中分为 Layouts(预置响应式仪表盘视图)和 Examples(面向特定领域、数据模型与集成的示例)两部分。每个图表区域由 .chart-wrapper、.chart-title、.chart-stage、.chart-notes 等结构组成,在 .chart-stage 内放置图表容器即可。
模板本身不绑定数据源或图表库,可配合任意数据源与图表库使用;仓库中的示例已更新为使用 keen-dataviz.js 与 keen-analysis.js,并引用依赖的 CDN 版本。使用 keen-dataviz.js 生成图表时,图表外层 HTML 包装会自动渲染。若使用 Keen IO 服务,需注册账号并配置项目;仓库也提供 demo-data 目录下的示例数据 JavaScript 文件,可在没有账号时先接入演示数据。
使用方式为下载或克隆仓库,在 layouts 目录下选择模板并编辑对应的 .html 文件:引入脚本、把示例代码粘贴到 </body> 之前,再为模板中每个图表位置设置 id 并移除占位图片,同时需在样式表或行内 CSS 中为该节点指定高度。仓库同时提供 Dockerfile,可构建镜像并以容器方式运行。开发模板需要先用 Bower 安装依赖。项目采用 MIT 许可,可免费使用、修改、商用和分发,但演示图片、字体、图标等第三方素材需单独核对许可,外部托管或数据服务可能另行收费。
HTML后台
适合你的项目吗?
适用场景
- 为内部团队搭建数据看板页面
- 为客户交付带图表区域的后台界面原型
- 在已有 HTML 项目中复用响应式仪表盘版式
- 以示例数据快速演示 Keen IO 图表集成效果
适合人群
- 需要现成响应式后台仪表盘版式的开发者
- 使用 HTML 与 CSS 构建数据界面的前端人员
- 希望接入 Keen IO 数据可视化 SDK 的项目
- 需要可自由修改并商用的 MIT 许可模板的团队
上手与定制指南
结合仓库当前版本的说明,按下面的资料检查内容、配置与运行要求。
- 1
下载仓库 zip 或执行 git clone keen/dashboards 获取模板
- 2
在 layouts 目录选择模板,编辑对应 .html 文件并引入所需脚本
- 3
为每个图表容器设置 id,移除占位 img,并在样式表或行内 CSS 中指定该节点高度
- 4
无 Keen IO 账号时可先使用仓库 demo-data 目录中的示例数据
- 5
开发模板需先安装 Bower 并执行 bower install;也可用 Dockerfile 构建镜像运行
授权与来源资料
使用条件与限制
免费使用 · 保留许可声明本次收录的是公开仓库中采用 MIT 许可的免费版本;免费范围为该版本代码,不代表外部服务或第三方素材免费。
使用时需要遵守
- 允许免费使用、修改、商用和分发该版本代码。
- 分发代码副本或实质性部分时,保留原作者版权声明和完整 MIT 许可声明。
- 代码按现状提供;担保与责任限制以原许可证及适用法律为准。
额外费用与待核对事项
- 使用 Keen IO 服务需注册账号并登录项目;无账号时可改用仓库 demo-data 目录中的示例数据。
- 模板本身不绑定数据源,但与 Keen IO 的 Dataviz SDK 集成最为顺畅,使用该 SDK 需接入 Keen IO 服务。
- 开发模板需先安装 Bower 并执行 bower install 安装依赖。
- 接入 Keen IO 服务需联系其团队开通,可能涉及外部服务费用。
- 演示图片、字体、图标及其他第三方素材需按各自许可核对,不能仅凭代码的 MIT 许可判断。
- 域名、托管、数据库、支付或 AI 等外部服务可能另外收费。
查看原文依据
Permission is hereby granted, free of charge
许可证原文
If you're a registered Keen IO user, navigate to [your keen project](http://keen.io/login?s=gh-dashboards) or if you don't have a user at first, you can simply use some demo data that we've prepared for you.
README 原文
These templates can work with any data source or charting library, but they're particularly streamlined to work with Keen IO's [Dataviz SDK](https://github.com/keen/keen-dataviz.js).
README 原文
To develop, you'll need to first install dependencies using [Bower](http://bower.io/):
README 原文
https://github.com/keen/dashboards/blob/master/LICENSEhttps://github.com/keen/dashboards/blob/master/README.mdTalk to our team](https://try.keen.io/contact) to get started today.
README 原文
DeepSeek 根据仓库许可证和 README 整理 ·2026-10-02。结果仅覆盖已读取资料,依赖、图片、字体及后续条款变更以各自原文为准。
项目核对记录与介绍依据
模板资料
- 来源平台
- GitHub
- 资料与维护参考分
- 资料较完整 · 80 / 100
- 技术栈
- HTML
- 网站类型
- 后台
这个分数如何计算
本站按许可资料(最高30分)、演示链接(12分)、预览图(10分)、Star数(15分)、记录的维护时间(15分)、描述完整度(8分)、功能记录(5分)和分类资料(5分)计算。它不是代码、安全或性能测试,也不是 Google 评分;有链接不代表已实测可用。
这个项目需要核对什么
- 记录的仓库更新时间
- 2021-11-02
- 截图检查日期
- 2026-10-02
已收录演示链接。请用你的内容与屏幕尺寸检查;有演示不代表表单、认证或支付已经可用。
目录记录的主要技术栈是 HTML。请通过依赖清单和锁文件核对实际版本与托管要求。这些说明基于收录资料,不代表代码审计或部署实测。
查看具体选型方法 →介绍的制作与核对状态
介绍由 AI 辅助整理目录与仓库资料。仓库作者不等于这篇介绍的审核者。
已完成服务器许可规则与 AI 来源核对;未经过人工编辑审核。
查看当时使用的来源资料
SHA-256: 7791d0af6323a1b94a08a7a9b24f975c274f8872cef6d6fa955dbd261a019b38
2026-10-02T07:10:57.527Z
来源文件 / 仓库# Dashboards by Keen IO
Building an analytics dashboard? Don’t start from scratch. Grab one of our CSS Grid-based templates and admire your data in minutes.
**UPDATE: All examples in this repo have been updated to use [keen-dataviz.js](https://github.com/keen/keen-dataviz.js) and [keen-analysis.js](https://github.com/keen/keen-analysis.js), as well as CDN versions of all dependencies.** When producing charts with [keen-dataviz.js](https://github.com/keen/keen-dataviz.js), the HTML wrapper for each chart (`.chart-wrapper`, described below) is rendered automatically.
Begin with a layout:

Add charts to each `chart-stage` HTML element:
```html
<div class="grid-hero">
<div class="hero chart-wrapper">
<div class="chart-title">
Chart Title
</div>
<div class="chart-stage">
<div id="grid-1-1">
<!-- chart goes here! -->
</div>
</div>
<div class="chart-notes">
Notes about this chart (optional)
</div>
</div>
</div>
```
And voilà!

An attractive, custom analytics dashboard that's ready to be shown to your team or your customers. No hours lost tweaking CSS or testing responsiveness on eight different mobile devices.
## The Templates
These layout templates are composed of a minimal set of custom styles. They cover the most common use cases and layout configurations we've encountered so far.
* [Layouts](http://keen.github.io/dashboards/layouts/) for pre-built, responsive dashboard views
* [Examples](http://keen.github.io/dashboards/examples/) for specific domains, data models and popular integrations
## Integrations
These templates can work with any data source or charting library, but they're particularly streamlined to work with Keen IO's [Dataviz SDK](https://github.com/keen/keen-dataviz.js). You can add some charts to your dashboard with just a few lines of code. [Talk to our team](https://try.keen.io/contact) to get started today.
## Usage
Ready to use one of these awesome layouts? Here's how to get started.
1. Download a copy of this repository as a zip file, using [this link](https://github.com/keen/dashboards/archive/gh-pages.zip). You can also type `git clone keen/dashboards` in your terminal.
2. Check out the various [layouts](http://keen.github.io/dashboards/layouts/) and pick the one that best suits your needs. Find the template in the repository you downloaded at `folder/layouts/(name-of-template)`.
3. Start editing! In the destination folder will exist an `.html` file. Open it in your favorite text editor. There are three things you need to do to edit your dashboard:
1. Setup: If you're a registered Keen IO user, navigate to [your keen project](http://keen.io/login?s=gh-dashboards) or if you don't have a user at first, you can simply use some demo data that we've prepared for you. You can access those by going to the repository and navigating to demo-data. There, you will see some javascript files with some code in them. We will simply paste those in the .html file.
2. Some copypasta. When you navigate to the bottom of the .html file, you can see that there are a bunch of script tags. Just before the end of the body tag, we're going to add in the code from sample.html. Simply copy and paste the code just before you see ```</body>```.
3. Once you've done that we need to hook up the specific items within the template to the code that we've just pasted in to our file. Each KeenDataviz instance has `container` property, which is a node selector required by *query*. That means that this *query* will try to find inside the html file a specified node. Please bear in mind that you have to set a height of this node in your stylesheet or using inline CSS. In these templates, you will see lines of that resemble something like:
```html
<div class="chart-stage"> <!-- This is where you need to put the id property in! -->
<img data-src="holder.js/100%x650/white">
</div>
```
Now we're going to change those lines so that it looks like this:
```html
<div class="chart-stage" id="chart-01"> <!-- This is where you need to put the id property in! -->
<!-- Get rid of that img tag! -->
</div>
```
You're finished! Congratulations on setting up your first chart! Repeat step three with the rest of the items in the template to complete your dashboard!
## Docker
Clone the repository.
```
$ git clone https://github.com/keen/dashboards.git
```
Access the repository and build your Docker image.
```
$ cd dashboards
$ docker build -t keen/dashboards .
```
Run the Docker container.
```
$ docker run -d -p 80:80 keen/dashboards
```
## Contributing
Contributions are 11,000,000% welcome! That's a lot!
Please file issues for any bugs you find or features you'd like to see. And if you're up for it, send in a pull request.
To develop, you'll need to first install dependencies using [Bower](http://bower.io/):
```
$ npm install -g bower
$ bower install
```
Note: Updates to the site backed by the **gh-pages** branch go live immediately once pull requests are reviewed and approved.
Note #2: This project is moving fast, so make sure and stay up to date. Here's what we suggest. Fork this repo, clone the fork, and add the original repo as a remote called `upstream`:
```
$ git clone https://github.com/keen/dashboards.git
$ cd dashboards
$ git remote add upstream https://github.com/keen/dashboards.git
```
Pull from `upstream` frequently to keep your local copy up to date:
```
$ git pull upstream gh-pages
```
## Support
Need a hand with something? Send us an email to [[email protected]](mailto:[email protected]) and we'll get back to you right away!
For technical questions, use the [`keen-io`](https://stackoverflow.com/questions/tagged/keen-io) tag on Stack Overflow.
看看同类模板
对比同技术栈与用途的模板,找到更适合的视觉与内容结构。
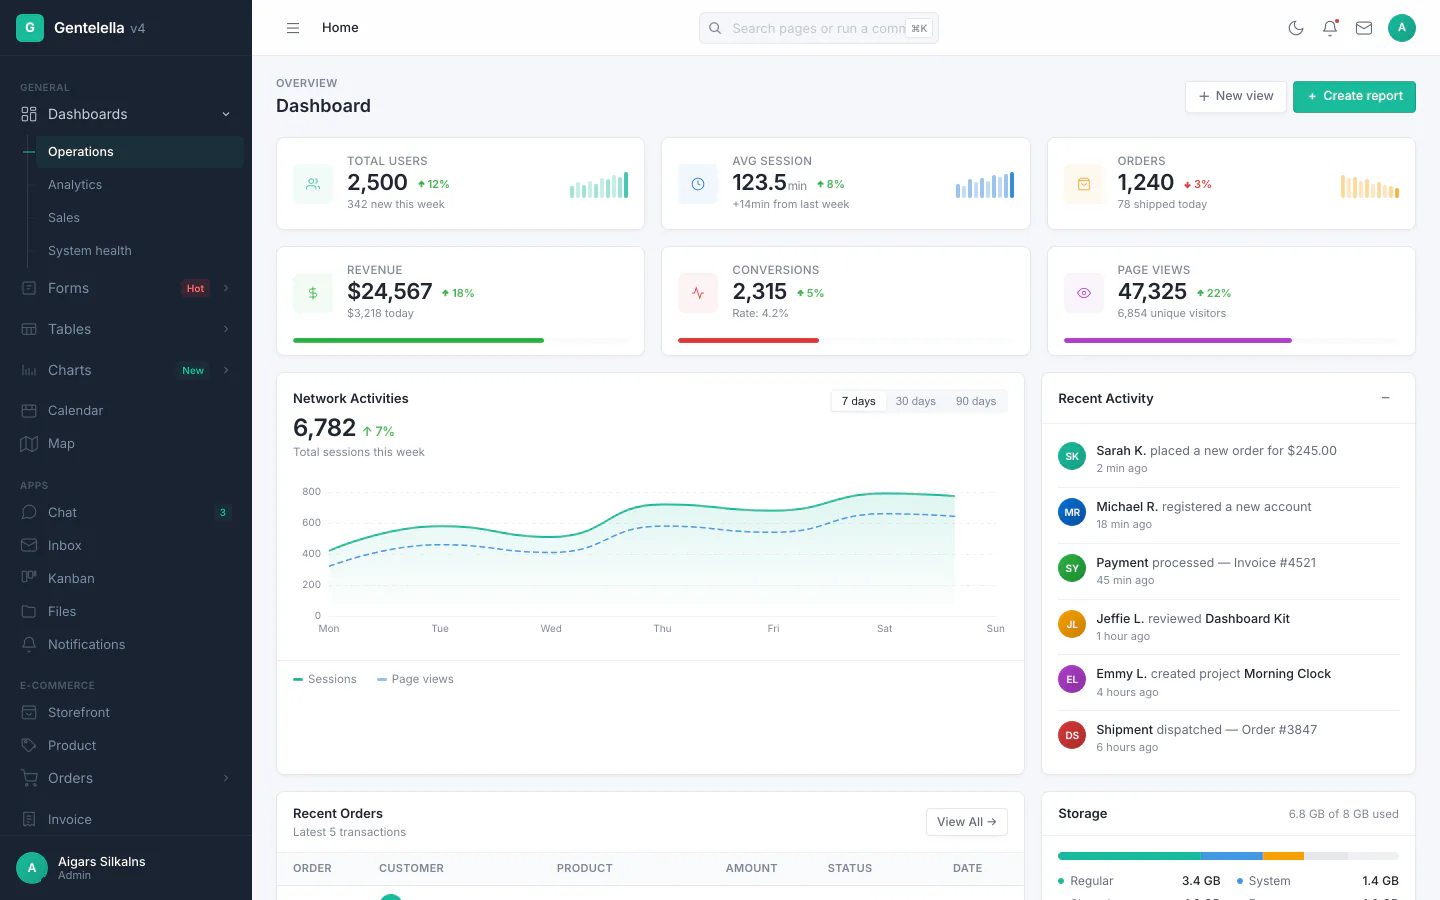
gentelella
Free admin dashboard template — vanilla JS, SCSS, Vite 8. No Bootstrap, no jQuery.
HTML · 后台
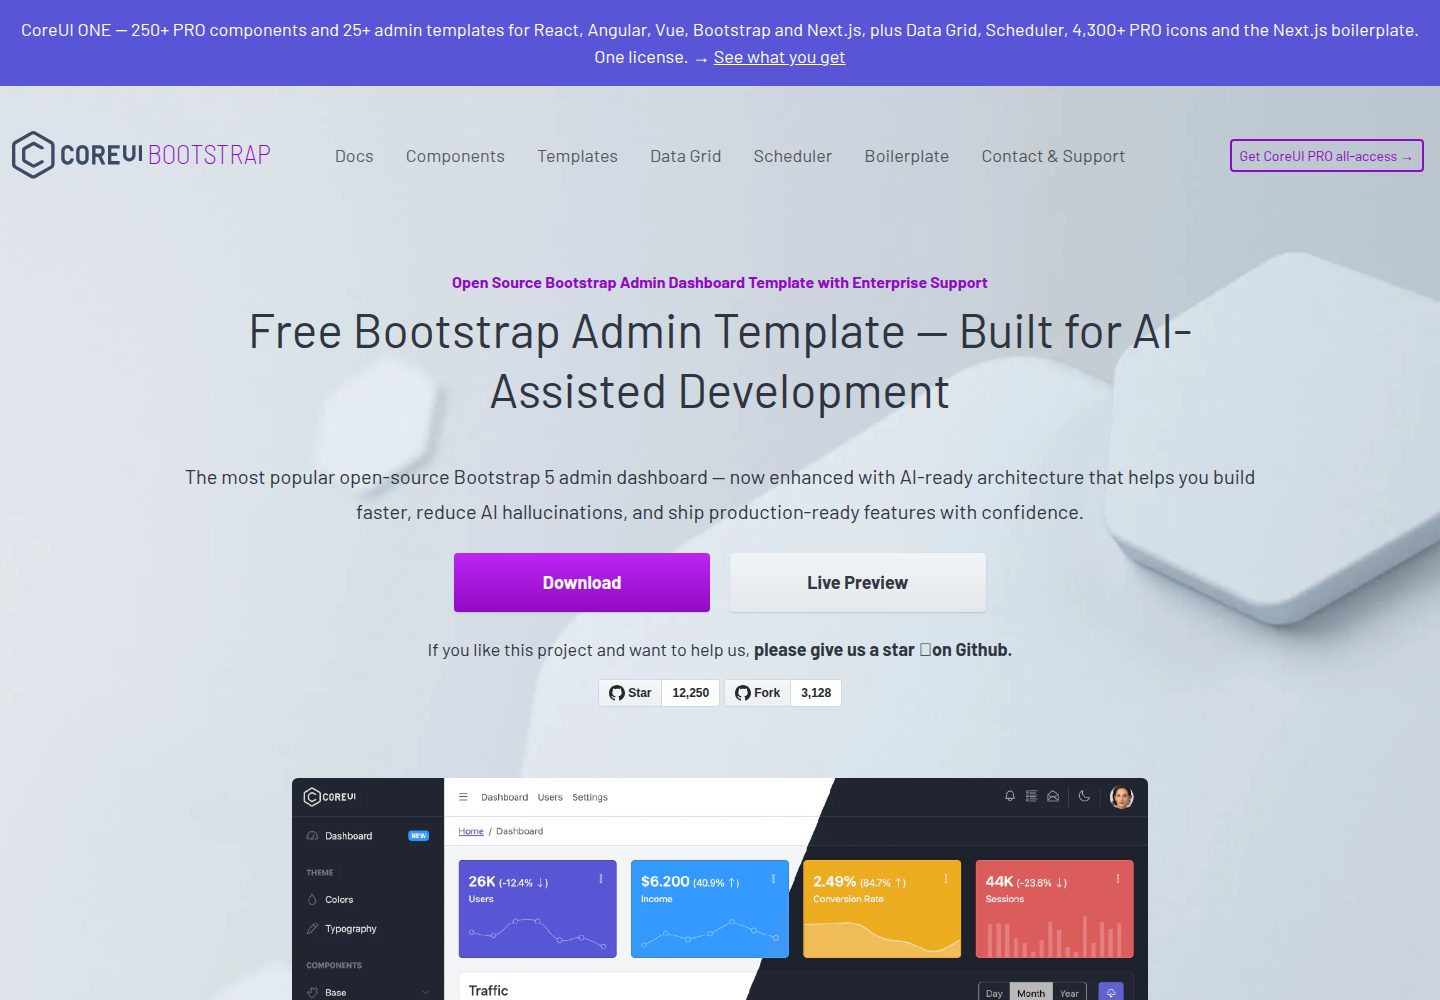
coreui-free-bootstrap-admin-template
Free Bootstrap Admin & Dashboard Template Built for AI-Assisted Development
HTML · 后台
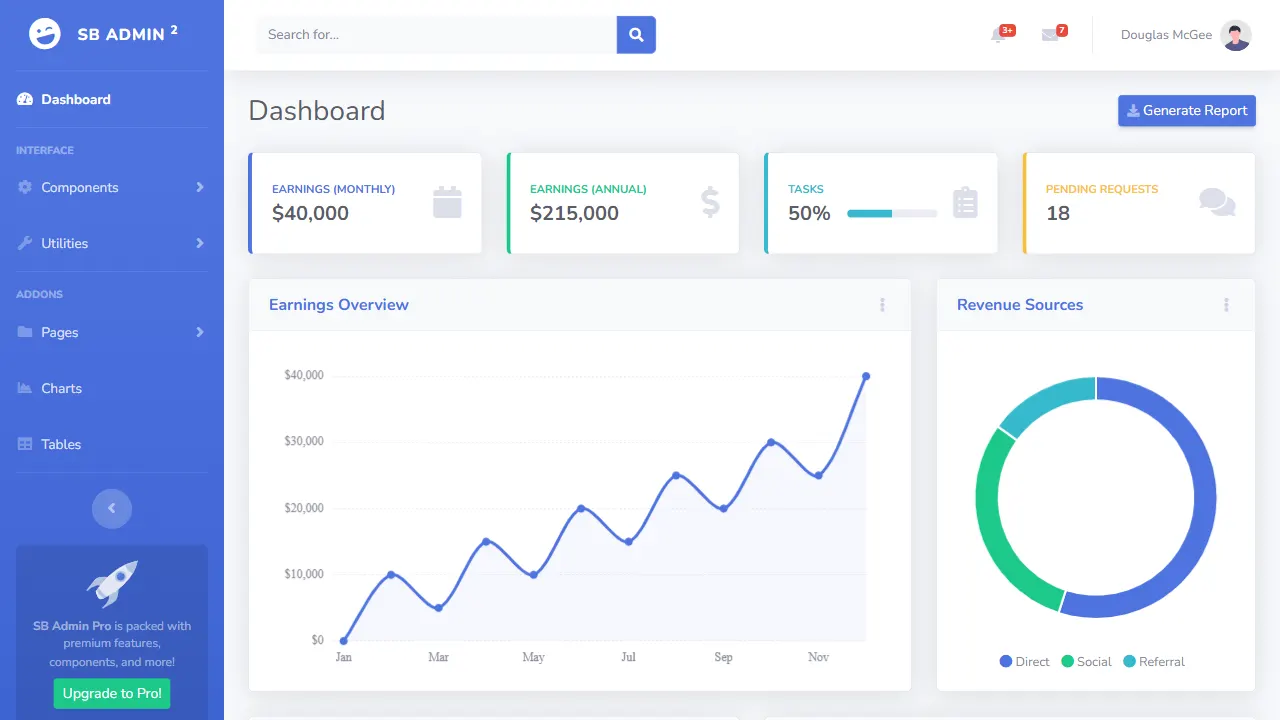
SB Admin 2
SB Admin 2 是 Start Bootstrap 推出的开源后台模板,基于 Bootstrap 构建,整体风格偏向经典管理界面。
HTML · 后台
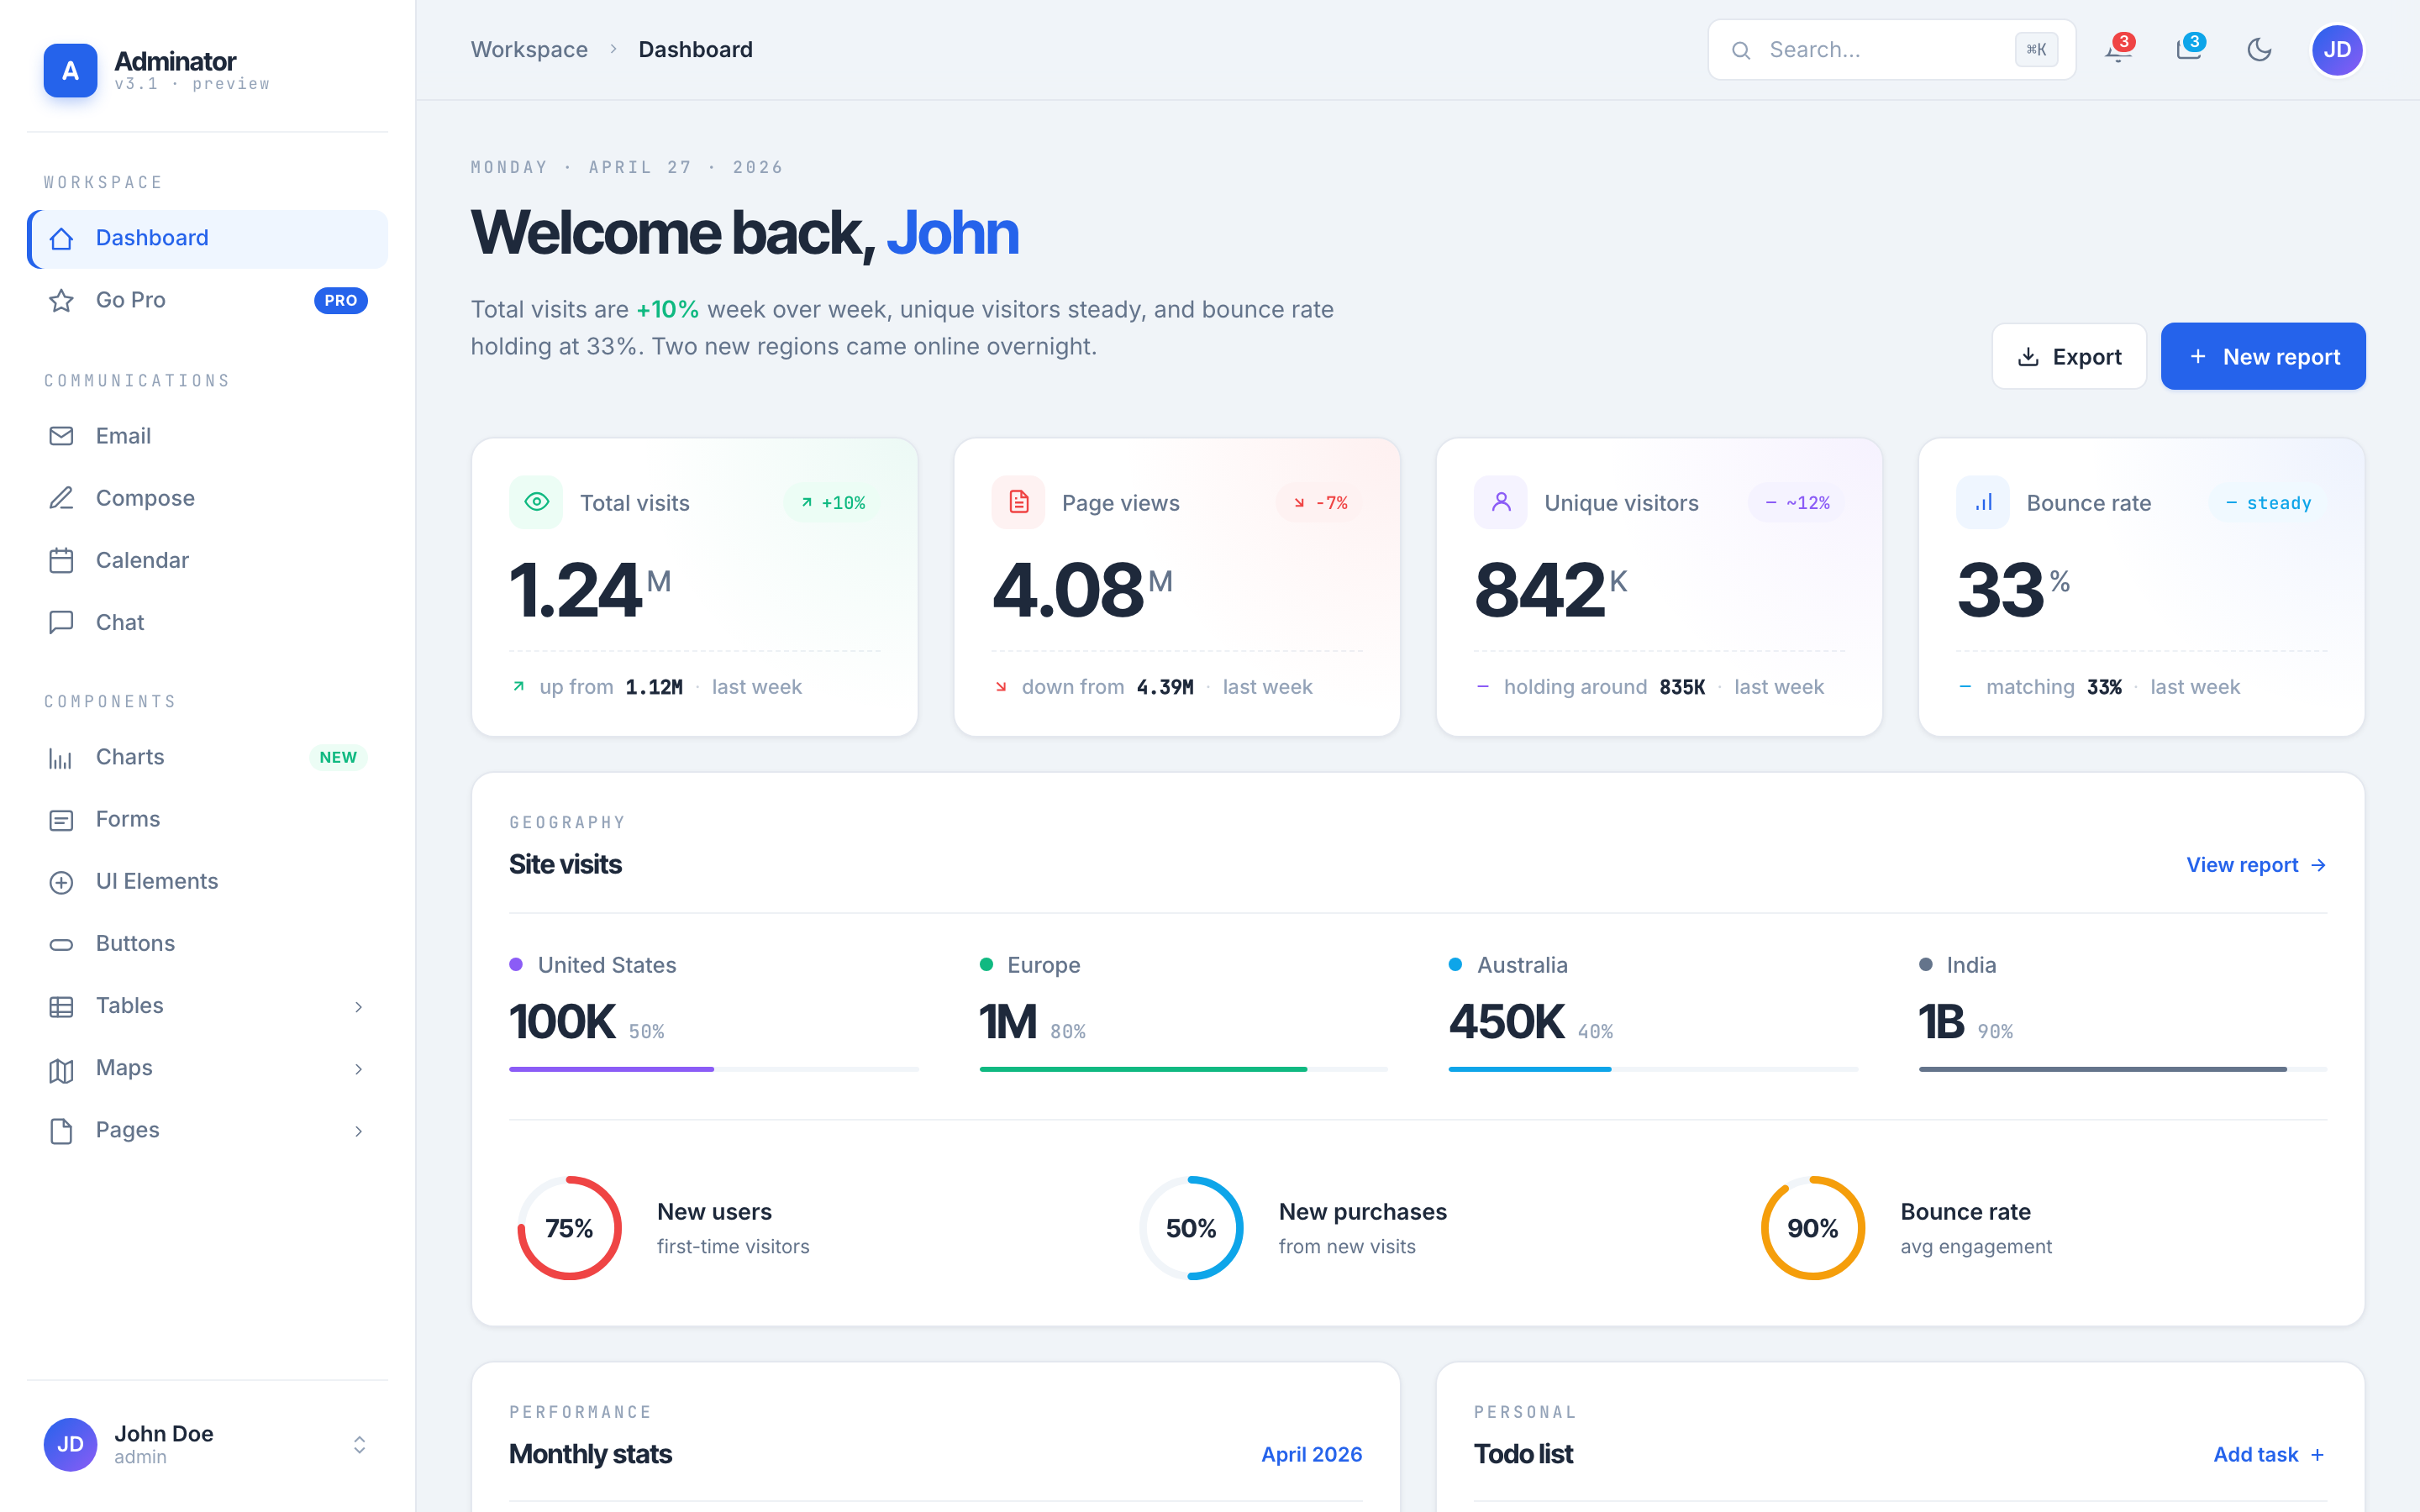
Adminator-admin-dashboard
Adminator is easy to use and well design admin dashboard template with dark mode for web apps, websites, servi…
HTML · 后台
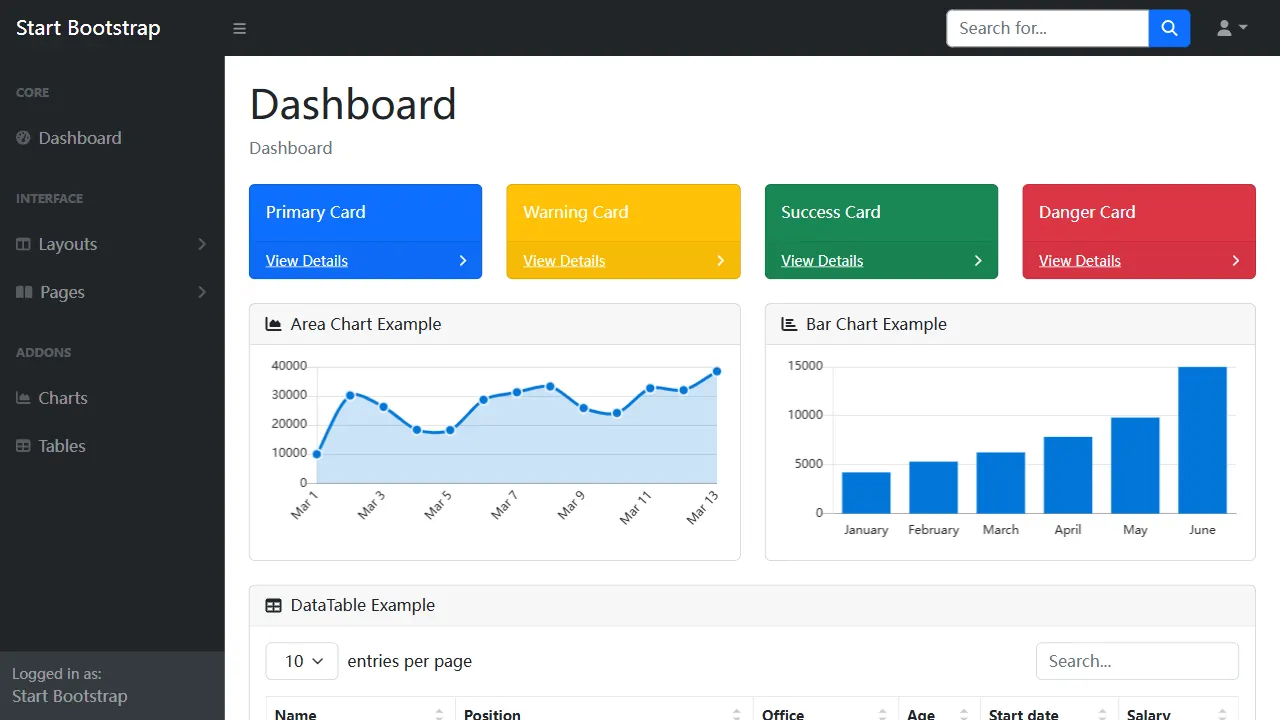
SB Admin
SB Admin 是 Start Bootstrap 推出的开源后台管理模板,基于 Bootstrap 构建,定位是简洁、实用的管理界面。
HTML · 后台
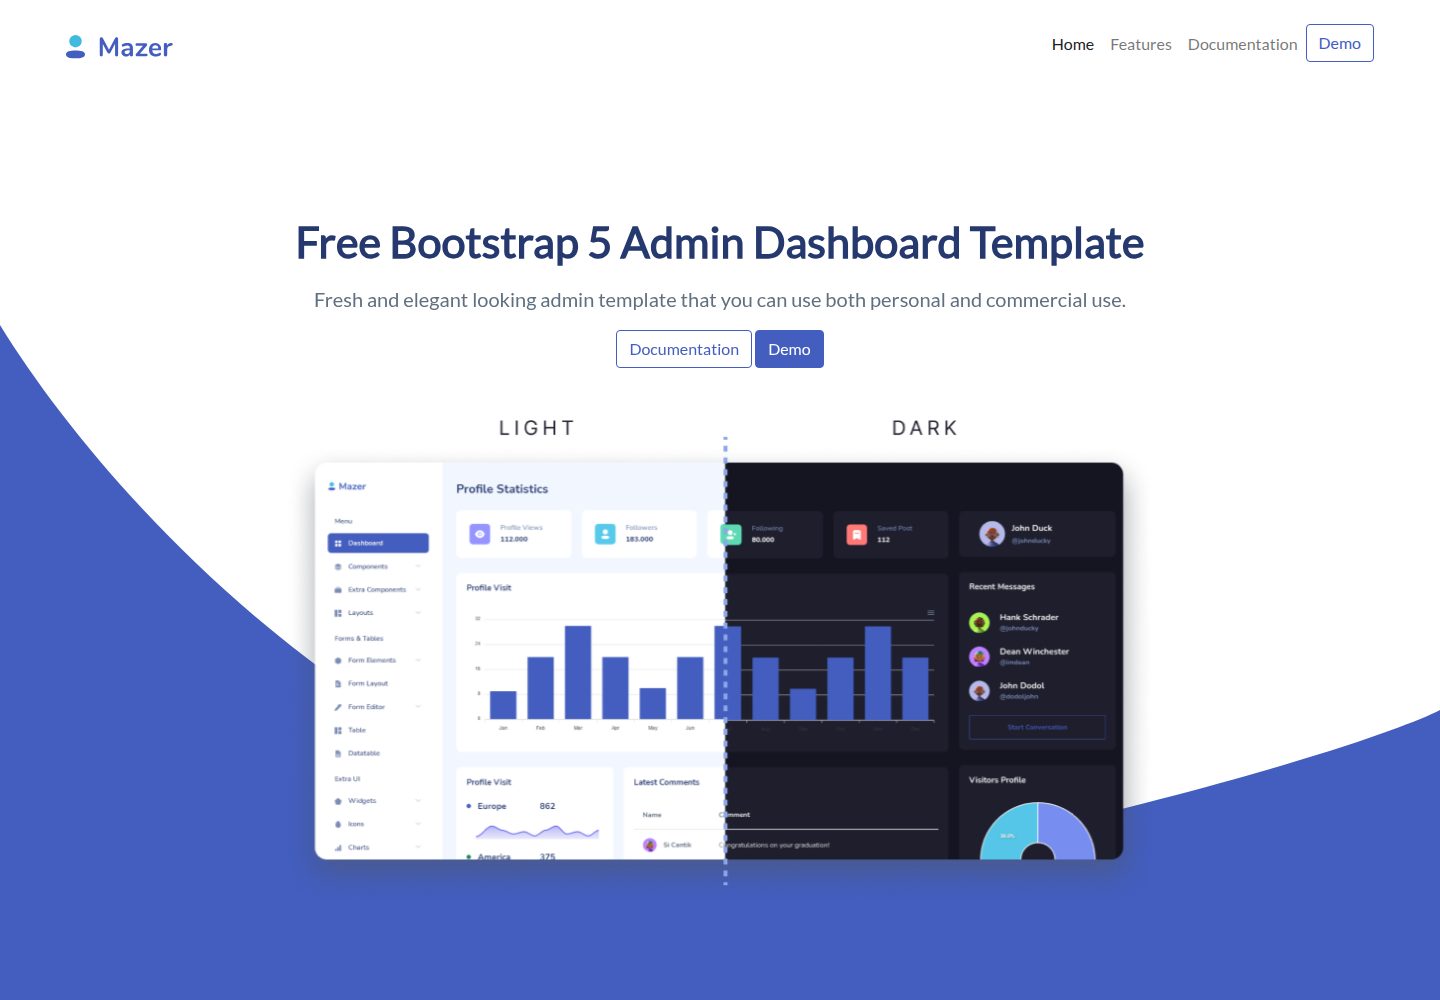
mazer
Free and Open-source Bootstrap 5 Admin Dashboard Template and Landing Page
HTML · 后台