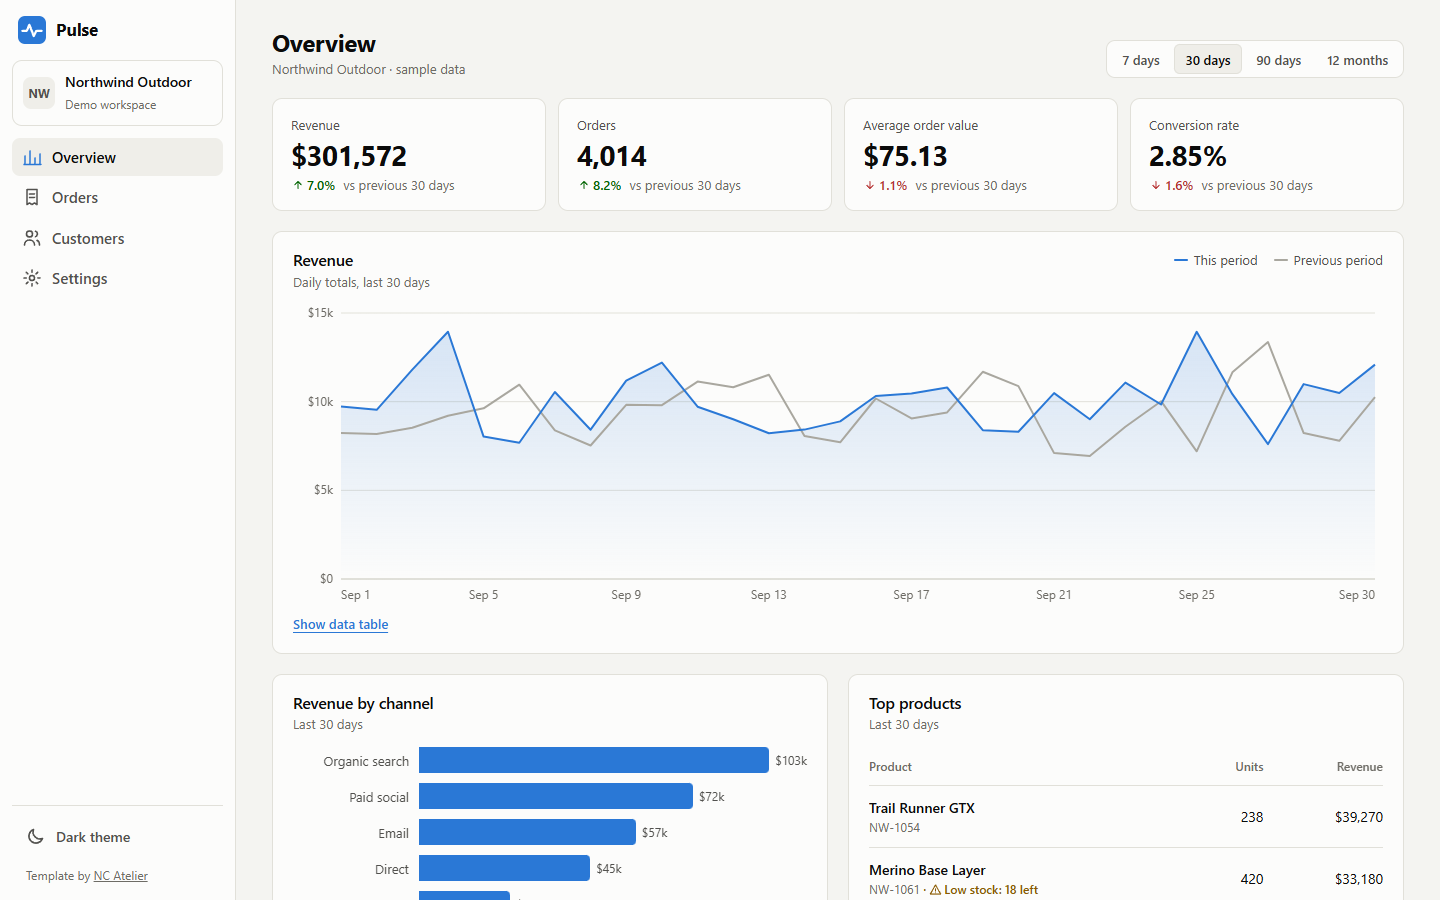
Includes four pages—Overview, Orders, Customers, and Settings—covering common sales analytics views
NuxtVueAdmin dashboard
dashboard-template — Nuxt Admin dashboard Template
By nicolascadet-ops
A sales analytics dashboard template built with Nuxt and Vue, featuring KPI cards, SVG charts, searchable and sortable tables, CSV export, and light/dark themes, using fictional data generated from a fixed seed.
Explore the design
Compare the page layouts and mobile experience. Open any screenshot for a closer look.
Author preview
Author-provided preview
Preview provided in the project README.
One original preview is available. Open the full image to inspect the design.
Screenshots show visual appearance; interactive behavior may differ.
Recorded 2026-10-03View source
What stands out
A quick read of the recorded project description.
Charts are hand-written SVG components without chart library dependencies, and each chart provides a data table view
Light and dark themes follow the system and remember user selection, with no flash on load
Tables support search, status filtering, column sorting, pagination, and CSV export of filtered results
Status badges use color, icon, and text labels simultaneously; charts use colorblind-friendly palettes
Pre-rendered as a static site at build time, deployable to static hosting such as Cloudflare Pages
Template Details
Pulse is a sales analytics dashboard template for SaaS, e-commerce, and internal tools, built with Nuxt (Vue). It provides four pages: Overview displays date range presets, KPI cards (with period-over-period changes), a revenue comparison chart, channel revenue, top products, and recent orders; Orders offers search, status filtering, column sorting, pagination, and CSV export of filtered results; Customers provides summary data, search, and a sortable customer table; Settings includes theme switching, report email validation, currency, and notification preferences.
Charts use hand-written SVG components without relying on chart libraries. Each chart includes a data table view, legend, hover tooltips, and colorblind-friendly palettes; status badges use color, icon, and text labels simultaneously. Themes support following the system and remembering user selection, with no flash on load. The responsive layout turns the sidebar into a menu on mobile and hides secondary table columns to preserve status and totals.
All data is fictional, generated from a fixed seed in app/utils/data.ts. Running the project requires Node.js 22.19 or higher. The build command runs nuxt generate to pre-render as a static site, deployable to static hosting such as Cloudflare Pages. When connecting real data, the README suggests fetching at build time (suitable for daily-updated reports) or fetching from an API in the browser (suitable for real-time numbers), and emphasizes adding authentication before connecting live data.
NuxtVueBackend
Is it right for your project?
Use Cases
- Building a sales data dashboard prototype for a SaaS or e-commerce product
- As a foundation for a data display interface in internal tools, replacing with your own API or database data
- A starting point for backend projects requiring light/dark themes, accessible charts, and exportable tables
- An example project for learning how Nuxt static generation combines with hand-written SVG charts
Suitable For
- Nuxt/Vue developers who need a sales analytics dashboard interface prototype
- Teams looking to deploy a data dashboard as a static site
- Backend projects focused on chart accessibility and light/dark themes
- Projects that need to quickly replace data sources and customize columns and color schemes
Getting started & customization
Use these recorded setup notes alongside the repository instructions for your chosen version.
- 1
Local running requires Node.js 22.19 or higher; run npm install then npm run dev, and visit http://localhost:3000
- 2
All data comes from app/utils/data.ts; replace the DAILY, ORDERS, and CUSTOMERS arrays and the topProducts function to connect your own data
- 3
The build command npm run build runs nuxt generate, outputting static files to .output/public; use npm run preview to preview
- 4
When deploying to Cloudflare Pages, the build command is npm run build and the output directory is .output/public
- 5
Add authentication (e.g., Cloudflare Access) before connecting real-time data
License & source material
Usage conditions & limitations
Free to use · keep license noticeThis entry covers the free version under the MIT license in a public repository; the free scope is the code of that version and does not imply that external services or third-party assets are free.
Must comply with when using
- Free use, modification, commercial use, and distribution of this version's code are permitted.
- When distributing copies or substantial portions of the code, retain the original author's copyright notice and the full MIT license notice.
- The code is provided as-is; warranties and limitations of liability are governed by the original license and applicable law.
Additional costs & items to verify
- Authentication must be added by yourself before connecting real data (e.g., Cloudflare Access); the template itself does not include authentication features.
- The template contains only fictional data generated from a fixed seed; you must replace it with data sources from your own API, database, or analytics tools.
- Local running and building require Node.js 22.19 or higher.
- Demo images, fonts, icons, and other third-party assets must be checked against their respective licenses; the code's MIT license alone is not sufficient to determine this.
- External services such as domains, hosting, databases, payments, or AI may incur additional charges.
View Original Text Basis
Permission is hereby granted, free of charge
Original License Text
For a real dashboard, put it behind authentication (for example Cloudflare Access) before connecting live data.
Original README
Replace the generated arrays (`DAILY`, `ORDERS`, `CUSTOMERS`) and the `topProducts` function with data from your API, database or analytics tool.
Original README
https://github.com/nicolascadet-ops/dashboard-template/blob/main/LICENSEhttps://github.com/nicolascadet-ops/dashboard-template/blob/main/README.mdRequires Node.js 22.19 or later.
Original README
Compiled by DeepSeek based on repository license and README ·2026-10-03. Results only cover the materials read; dependencies, images, fonts, and subsequent term changes are subject to their respective original texts.
Project checks & description sources
Template Information
- Source platforms
- GitHub
- Documentation and maintenance reference score
- Partly documented · 73 / 100
- Technologies
- Nuxt · Vue
- Website type
- Admin dashboard
How this score is calculated
Our heuristic uses license records (up to 30), a demo link (12), a preview (10), stars (15), recorded maintenance (15), description completeness (8), feature records (5) and classification data (5). It is not a code, security or performance test, or a Google score. A link does not establish tested functionality.
What to verify for this project
- Repository update recorded
- 2026-10-03
- Screenshot last checked
- 2026-10-03
No demo link is recorded. Use the repository instructions to evaluate the project locally; the screenshot alone cannot establish interactive behavior.
The catalog identifies Nuxt as the primary stack. Check the actual dependency manifest and lockfile for versions and hosting requirements. These notes use recorded metadata, not a code audit or a deployment test.
Use a selection guide →How this description was prepared
AI-assisted description based on catalog records and repository material. Repository authors are not automatically the reviewers of this description.
Review declaration: [email protected] · 2026-10-04
Inspect the recorded source material
SHA-256: 09e44057041deacc74643b3942d3aa14209fbb9943be1c444b6dc494f27ece20
2026-10-03T19:47:02.253Z
Source file / repository# Pulse: Analytics Dashboard Template A clean sales analytics dashboard for SaaS, e-commerce and internal tools. Built with [Nuxt](https://nuxt.com) (Vue), with light and dark themes, sortable tables and CSV export. Charts are lightweight SVG components with no chart library. Generates a static site, so it can be hosted anywhere.   > **All data is fictional.** "Northwind Outdoor", its orders, customers and figures are generated from a fixed seed in `app/utils/data.ts`. ## Pages | Page | What's on it | |---|---| | **Overview** | Date-range presets, KPI tiles with change vs previous period, revenue chart compared with the previous period (with a data-table view), revenue by channel, top products, recent orders | | **Orders** | Search, status filters, sortable columns, pagination, CSV export of the filtered rows | | **Customers** | Summary figures, search and a sortable customer table | | **Settings** | Theme (system / light / dark), report email with validation, currency and alert preferences | ## Features - **Light and dark themes**: follows the device by default, remembers the user's choice, no flash on load. - **Accessible charts**: one axis per chart, legends, hover tooltips, colour-blind-safe colours, and a data table for every chart. - **Status badges** that pair colour with an icon and a label, never colour alone. - **Responsive**: sidebar becomes a menu on phones; less important table columns hide so status and totals stay visible. - **Fast**: system fonts, static HTML, hand-built SVG charts (no chart library). ## Run it locally Requires Node.js 22.19 or later. ```bash npm install npm run dev ``` Open http://localhost:3000. ## Connect your own data All numbers come from `app/utils/data.ts`. Replace the generated arrays (`DAILY`, `ORDERS`, `CUSTOMERS`) and the `topProducts` function with data from your API, database or analytics tool. Two common approaches: 1. **Fetch at build time** in the page files, for reports that update daily (rebuild on a schedule). 2. **Fetch in the browser** from your API, for live numbers (add authentication in front of the dashboard). ## Customise | What | Where | |---|---| | Colours (light and dark), chart colours | CSS variables at the top of `app/assets/css/main.css` | | Navigation and workspace name | `app/app.vue` | | Charts | `app/components/RevenueChart.vue`, `app/components/ChannelChart.vue` | | Table columns | `COLUMNS` in `app/pages/orders.vue` and `app/pages/customers.vue` | | Date ranges | `RANGES` in `app/utils/data.ts` | | Icons | `app/utils/icons.ts` | ## Deploy to Cloudflare Pages `npm run build` runs `nuxt generate`, which pre-renders every page into a plain static site in `.output/public/`. Preview it with `npm run preview`. - **Dashboard:** Workers & Pages → Create → Pages → Connect to Git → pick this repo. Build command: `npm run build`. Output directory: `.output/public`. - **CLI:** ```bash npm run build npx wrangler pages deploy .output/public --project-name pulse-dashboard ``` For a real dashboard, put it behind authentication (for example Cloudflare Access) before connecting live data. ## Credits - Built with [Nuxt](https://nuxt.com) (MIT). - Built by **NC Atelier**. --- ### Want a dashboard like this for your business? NC Atelier designs and builds fast, accessible websites and web apps for businesses in the UK, US and Canada. **Get in touch:** [ncatelier.com](https://ncatelier.com) · [LinkedIn](https://www.linkedin.com/in/cadetnicolas)
Explore similar templates
Compare previews and descriptions within the same stack and category.
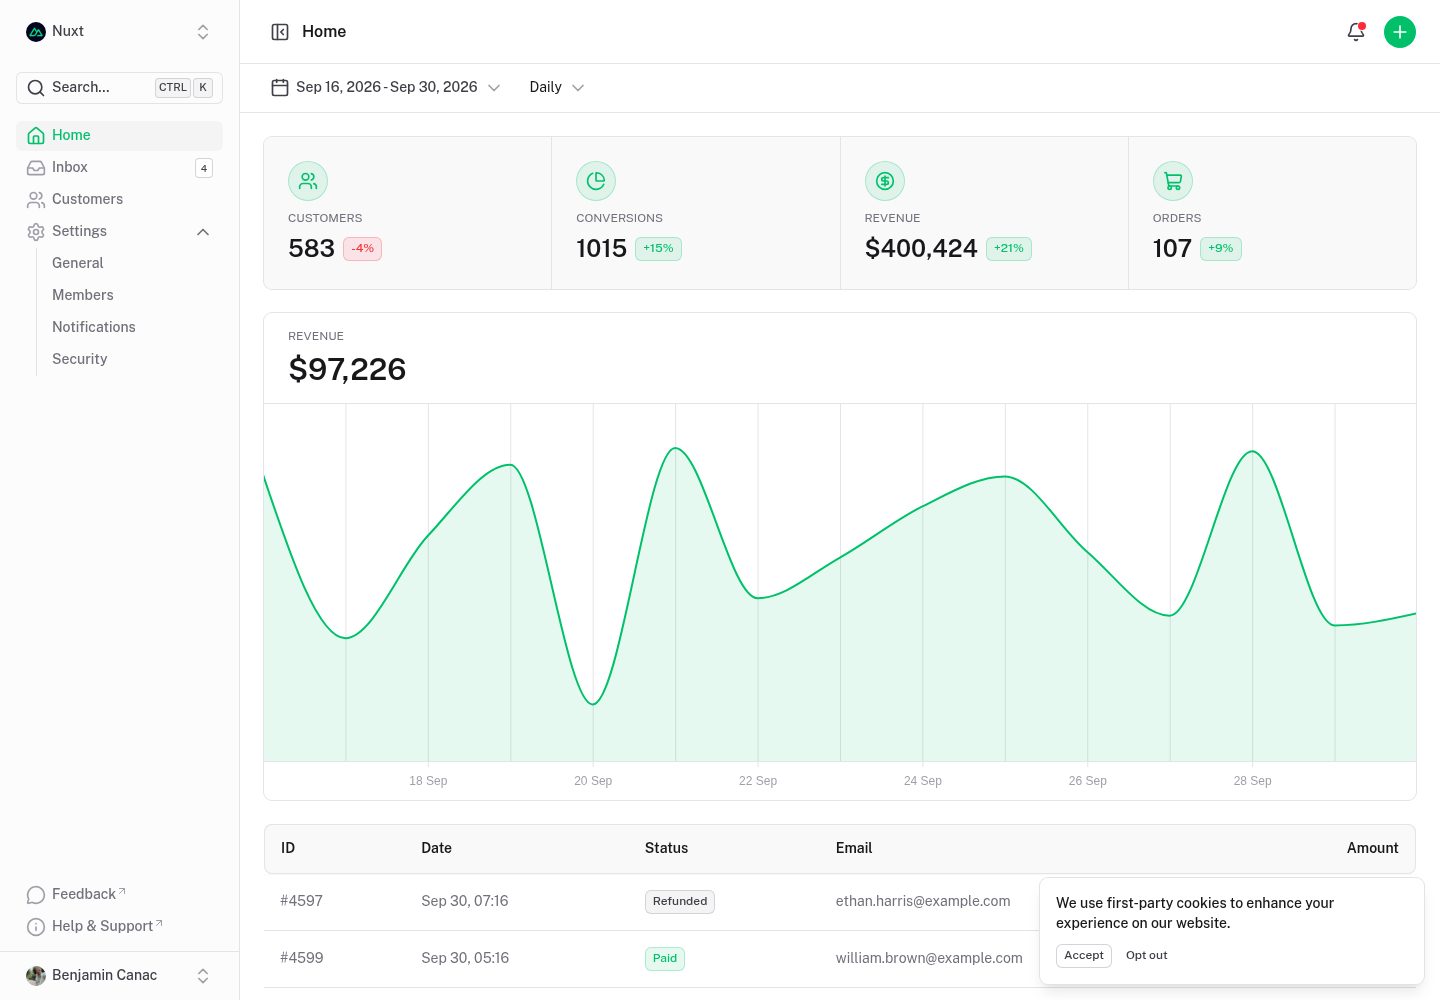
dashboard
A dashboard template built on Nuxt and Nuxt UI, offering multiple pages, a collapsible sidebar, keyboard shortcuts, light and dark modes, and a command palette.
Nuxt · Admin dashboard
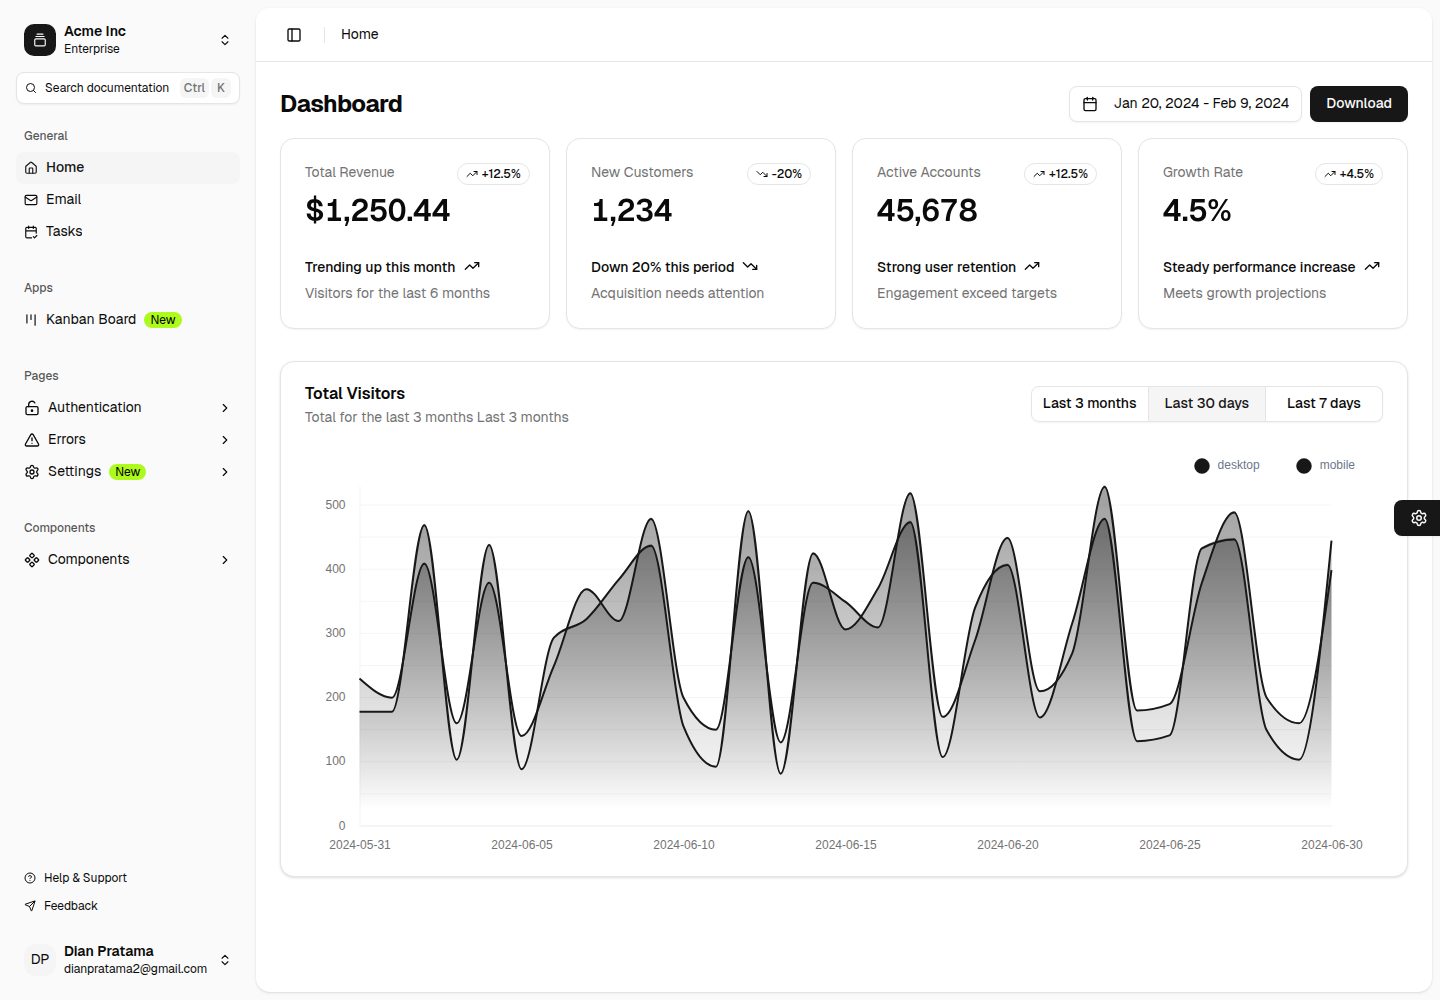
nuxt-shadcn-dashboard
A backend dashboard template built with Nuxt, Shadcn Vue, and TailwindCSS. It offers configurable sidebar collapse modes (offcanvas, icon, none), positions, and styles (sidebar, floating, inset), along with nine theme colors and three theme types.
Nuxt · Admin dashboard
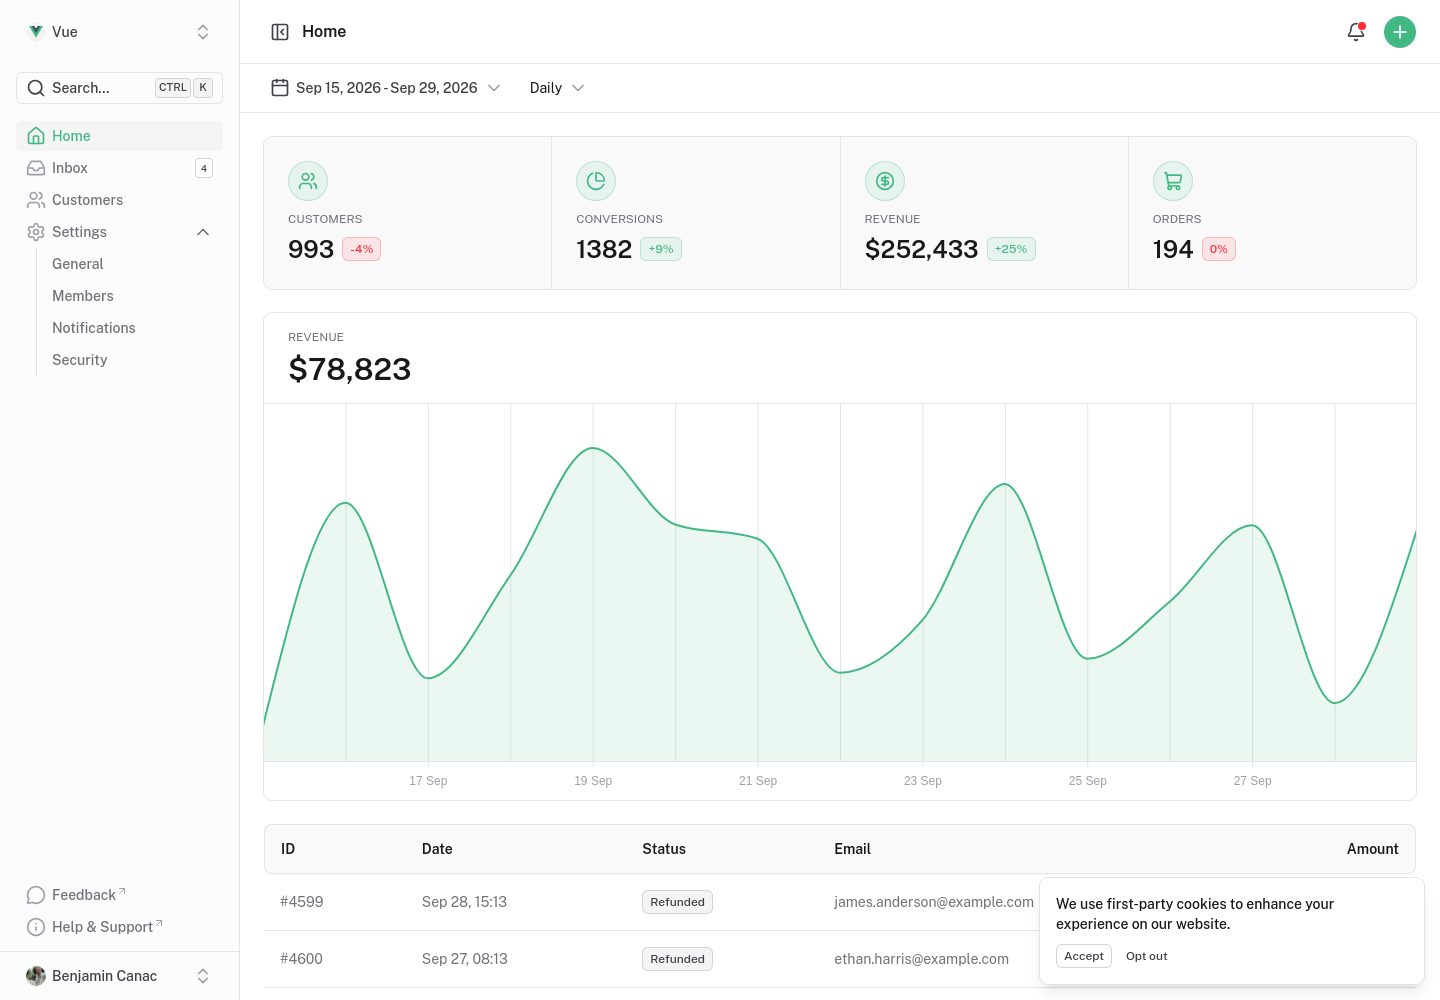
dashboard-vue
A Vue admin dashboard template built with Nuxt UI, offering multiple pages, a collapsible sidebar, keyboard shortcuts, light and dark modes, and a command palette. Suitable for admin backends, data dashboards, or as a reference for learning Nuxt UI layouts.
Nuxt · Admin dashboard
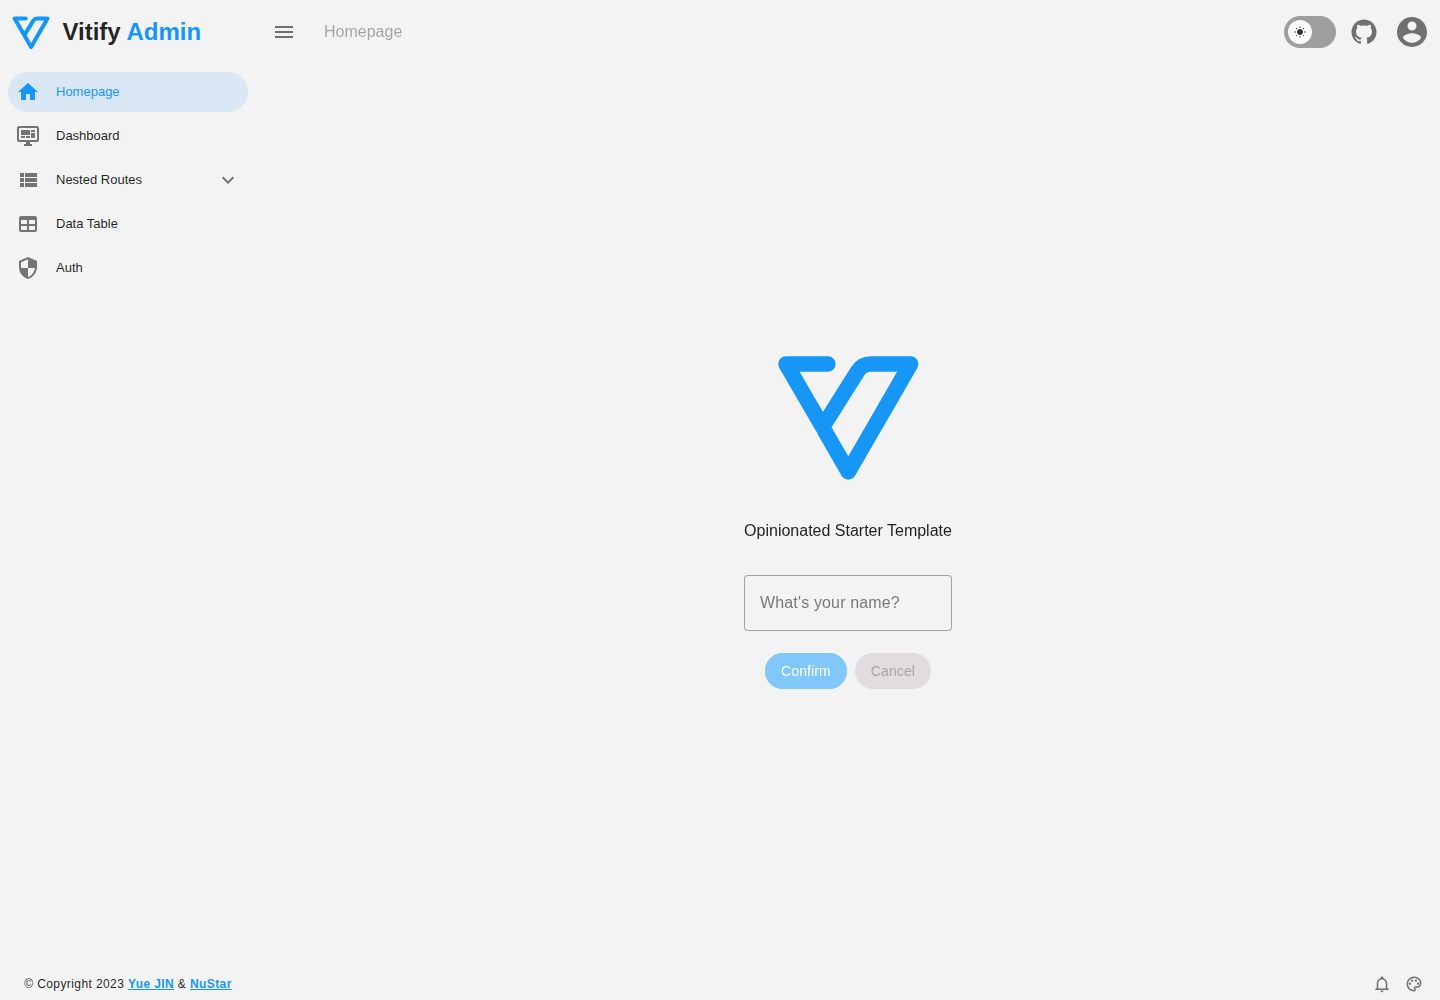
vitify-nuxt
Vitify Nuxt is an admin dashboard starter template built on Nuxt and Vuetify, featuring a drawer layout, automatic navigation and breadcrumbs, notification state, ECharts charts, theming and dark mode, and authentication via nuxt-auth-utils.
Nuxt · Admin dashboard
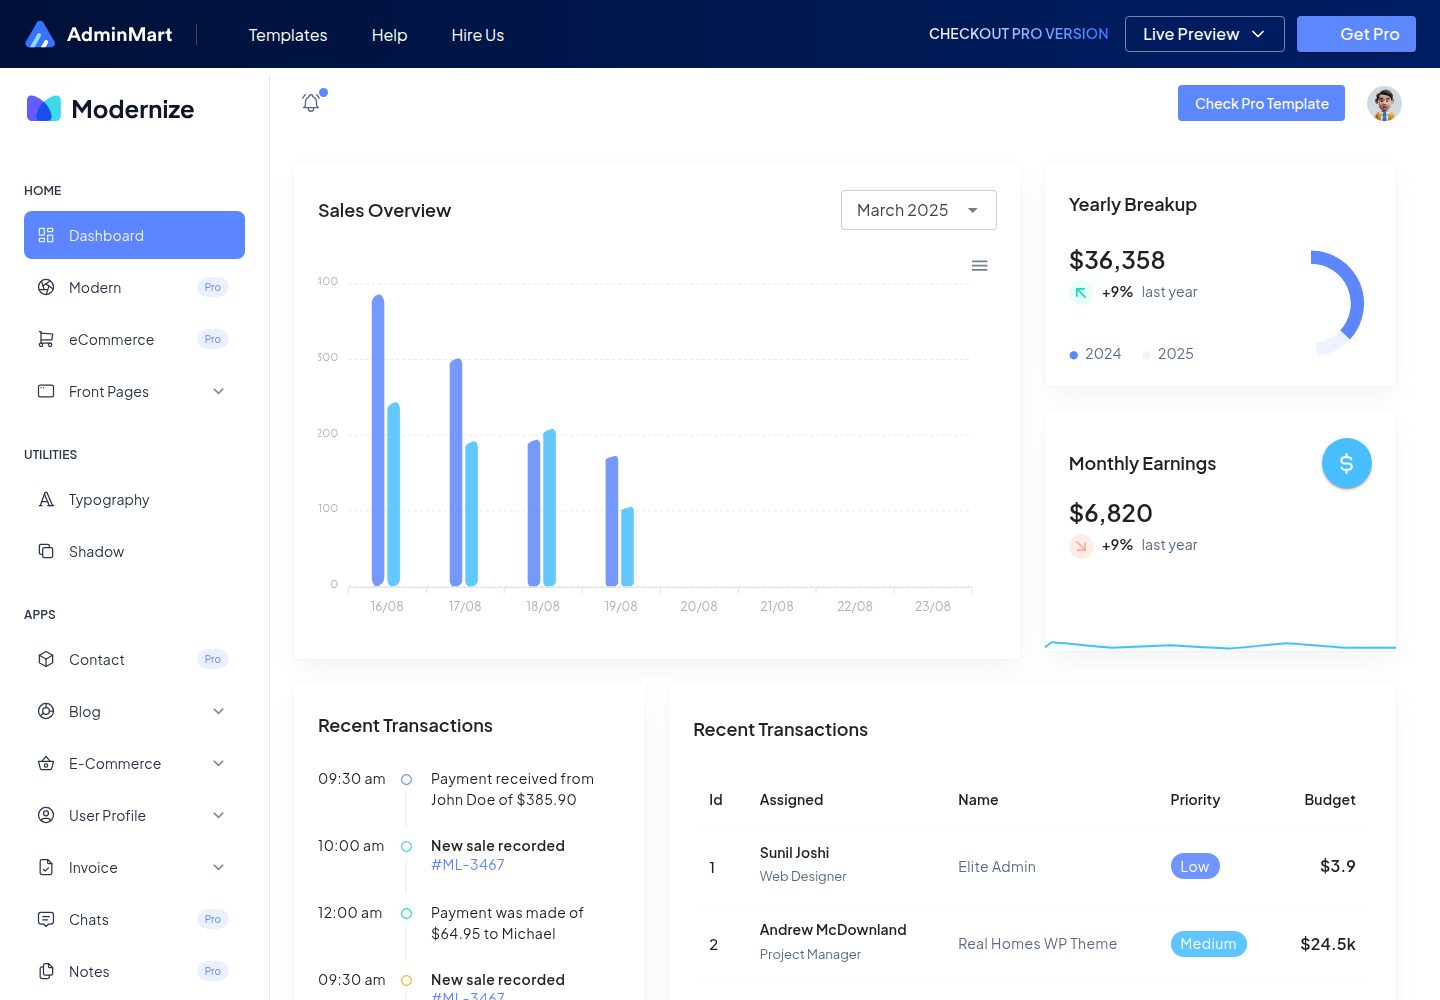
Modernize-nuxtjs-free
Modernize NuxtJS Free is a free, developer-oriented admin dashboard template from AdminMart, built with Nuxt, Vuetify, and TypeScript. It offers a responsive layout, basic pages and components, and Chart.js charts, making it suitable for admin panels, SaaS dashboard prototypes, and internal tools.
Nuxt · Admin dashboard
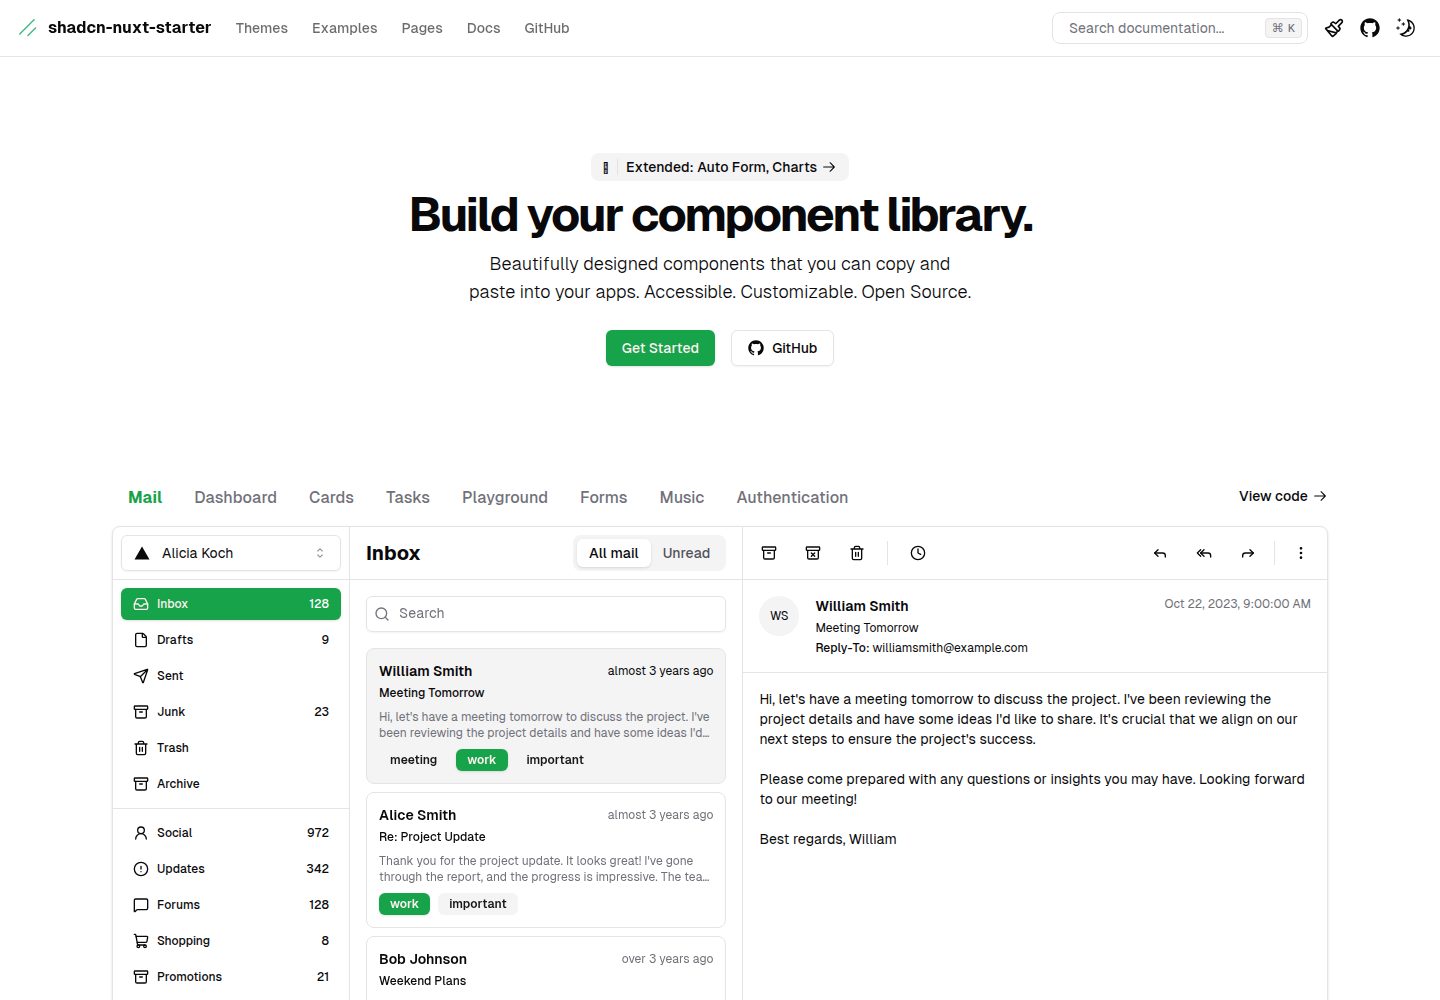
shadcn-nuxt-starter
A Nuxt 3 starter template using Shadcn-vue, UnoCSS, and TypeScript, with Vite as the build tool. It supports three rendering modes from one codebase: SSR for SaaS, SSG for documentation, and CSR for admin dashboards.
Nuxt · Admin dashboard